
Page 105 - Phase-Locked Loops Design, Simulation, and Applications
P. 105
MIXED-SIGNAL PLL ANALYSIS Ronald E. Best 70
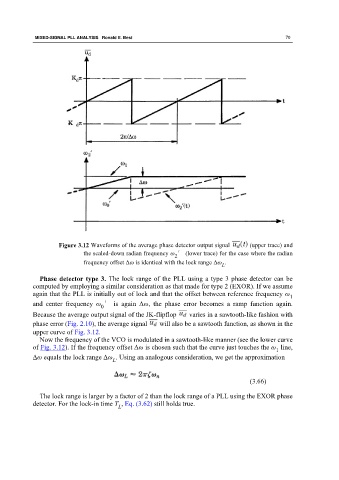
Figure 3.12 Waveforms of the average phase detector output signal (upper trace) and
the scaled-down radian frequency ω ′ (lower trace) for the case where the radian
2
frequency offset Δω is identical with the lock range Δω .
L
Phase detector type 3. The lock range of the PLL using a type 3 phase detector can be
computed by employing a similar consideration as that made for type 2 (EXOR). If we assume
again that the PLL is initially out of lock and that the offset between reference frequency ω
1
and center frequency ω ′ is again Δω, the phase error becomes a ramp function again.
0
Because the average output signal of the JK-flipflop varies in a sawtooth-like fashion with
phase error (Fig. 2.10), the average signal will also be a sawtooth function, as shown in the
upper curve of Fig. 3.12.
Now the frequency of the VCO is modulated in a sawtooth-like manner (see the lower curve
of Fig. 3.12). If the frequency offset Δω is chosen such that the curve just touches the ω line,
1
Δω equals the lock range Δω . Using an analogous consideration, we get the approximation
L
(3.66)
The lock range is larger by a factor of 2 than the lock range of a PLL using the EXOR phase
detector. For the lock-in time T , Eq. (3.62) still holds true.
L