
Page 107 - Phase-Locked Loops Design, Simulation, and Applications
P. 107
MIXED-SIGNAL PLL ANALYSIS Ronald E. Best 71
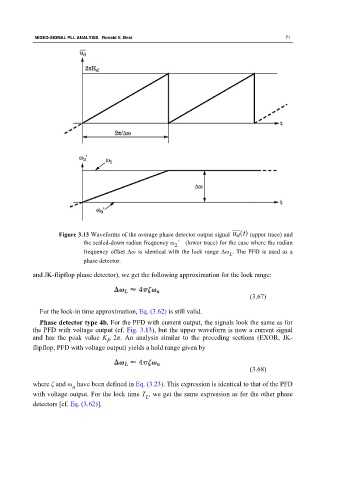
Figure 3.13 Waveforms of the average phase detector output signal (upper trace) and
the scaled-down radian frequency ω ′ (lower trace) for the case where the radian
2
frequency offset Δω is identical with the lock range Δω . The PFD is used as a
L
phase detector.
and JK-flipflop phase detector), we get the following approximation for the lock range:
(3.67)
For the lock-in time approximation, Eq. (3.62) is still valid.
Phase detector type 4b. For the PFD with current output, the signals look the same as for
the PFD with voltage output (cf. Fig. 3.13), but the upper waveform is now a current signal
and has the peak value K 2π. An analysis similar to the preceding sections (EXOR, JK-
P
flipflop, PFD with voltage output) yields a hold range given by
(3.68)
where ζ and ω have been defined in Eq. (3.23). This expression is identical to that of the PFD
n
with voltage output. For the lock time T , we get the same expression as for the other phase
L
detectors [cf. Eq. (3.62)].