Page 3 - Phase-Locked Loops Design, Simulation, and Applications
P. 3

INTRODUCTION TO PLLS   Ronald E. Best                                               2


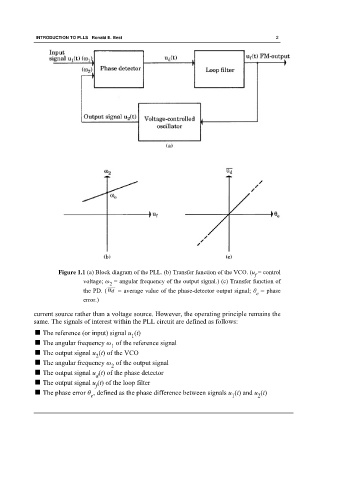
                      Figure 1.1 (a) Block diagram of the PLL. (b) Transfer function of the VCO. (u  = control
                                                                                           f
                              voltage; ω  = angular frequency of the output signal.) (c) Transfer function of
                                       2
                              the PD. (    = average value of the phase-detector output signal; θ  = phase
                                                                                           e
                              error.)

             current source rather than a voltage source. However, the operating principle remains the
             same. The signals of interest within the PLL circuit are defined as follows:
             ■ The reference (or input) signal u (t)
                                               1
             ■ The angular frequency ω  of the reference signal
                                        1
             ■ The output signal u (t) of the VCO
                                   2
             ■ The angular frequency ω  of the output signal
                                        2
             ■ The output signal u (t) of the phase detector
                                   d
             ■ The output signal u (t) of the loop filter
                                   f
             ■ The phase error θ , defined as the phase difference between signals u (t) and u (t)
                                 e                                                1         2
   1   2   3   4   5   6   7   8