
Page 62 - Phase-Locked Loops Design, Simulation, and Applications
P. 62
MIXED-SIGNAL PLL ANALYSIS Ronald E. Best 44
1
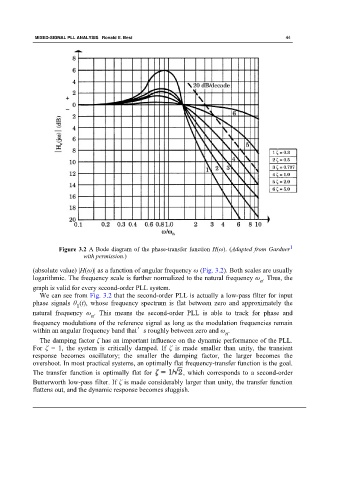
Figure 3.2 A Bode diagram of the phase-transfer function H(ω). (Adapted from Gardner
with permission.)
(absolute value) |H(ω)| as a function of angular frequency ω (Fig. 3.2). Both scales are usually
logarithmic. The frequency scale is further normalized to the natural frequency ω . Thus, the
n
graph is valid for every second-order PLL system.
We can see from Fig. 3.2 that the second-order PLL is actually a low-pass filter for input
phase signals θ (t), whose frequency spectrum is flat between zero and approximately the
1
natural frequency ω . This means the second-order PLL is able to track for phase and
n
frequency modulations of the reference signal as long as the modulation frequencies remain
within an angular frequency band that’s roughly between zero and ω .
n
The damping factor ζ has an important influence on the dynamic performance of the PLL.
For ζ = 1, the system is critically damped. If ζ is made smaller than unity, the transient
response becomes oscillatory; the smaller the damping factor, the larger becomes the
overshoot. In most practical systems, an optimally flat frequency-transfer function is the goal.
The transfer function is optimally flat for , which corresponds to a second-order
Butterworth low-pass filter. If ζ is made considerably larger than unity, the transfer function
flattens out, and the dynamic response becomes sluggish.