
Page 63 - Phase-Locked Loops Design, Simulation, and Applications
P. 63
MIXED-SIGNAL PLL ANALYSIS Ronald E. Best 45
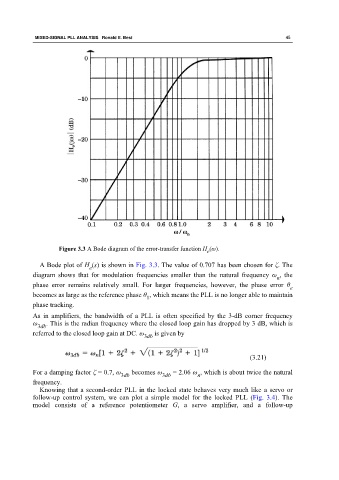
Figure 3.3 A Bode diagram of the error-transfer function H (ω).
e
A Bode plot of H (s) is shown in Fig. 3.3. The value of 0.707 has been chosen for ζ. The
e
diagram shows that for modulation frequencies smaller than the natural frequency ω , the
n
phase error remains relatively small. For larger frequencies, however, the phase error θ
e
becomes as large as the reference phase θ , which means the PLL is no longer able to maintain
1
phase tracking.
As in amplifiers, the bandwidth of a PLL is often specified by the 3-dB corner frequency
ω 3db . This is the radian frequency where the closed loop gain has dropped by 3 dB, which is
referred to the closed loop gain at DC. ω is given by
3db
(3.21)
For a damping factor ζ = 0.7, ω 3db becomes ω 3db = 2.06 ω , which is about twice the natural
n
frequency.
Knowing that a second-order PLL in the locked state behaves very much like a servo or
follow-up control system, we can plot a simple model for the locked PLL (Fig. 3.4). The
model consists of a reference potentiometer G, a servo amplifier, and a follow-up