
Page 116 - Photonics Essentials an introduction with experiments
P. 116
Light-Emitting Diodes
110 Photonic Devices
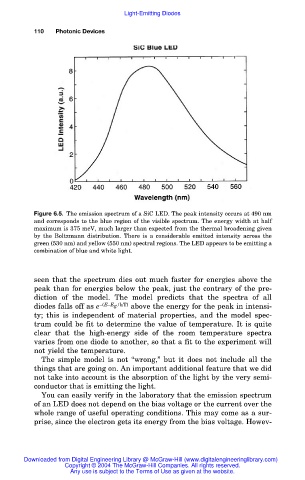
Figure 6.5. The emission spectrum of a SiC LED. The peak intensity occurs at 490 nm
and corresponds to the blue region of the visible spectrum. The energy width at half
maximum is 375 meV, much larger than expected from the thermal broadening given
by the Boltzmann distribution. There is a considerable emitted intensity across the
green (530 nm) and yellow (550 nm) spectral regions. The LED appears to be emitting a
combination of blue and white light.
seen that the spectrum dies out much faster for energies above the
peak than for energies below the peak, just the contrary of the pre-
diction of the model. The model predicts that the spectra of all
diodes falls off as e –(E–E g /kT) above the energy for the peak in intensi-
ty; this is independent of material properties, and the model spec-
trum could be fit to determine the value of temperature. It is quite
clear that the high-energy side of the room temperature spectra
varies from one diode to another, so that a fit to the experiment will
not yield the temperature.
The simple model is not “wrong,” but it does not include all the
things that are going on. An important additional feature that we did
not take into account is the absorption of the light by the very semi-
conductor that is emitting the light.
You can easily verify in the laboratory that the emission spectrum
of an LED does not depend on the bias voltage or the current over the
whole range of useful operating conditions. This may come as a sur-
prise, since the electron gets its energy from the bias voltage. Howev-
Downloaded from Digital Engineering Library @ McGraw-Hill (www.digitalengineeringlibrary.com)
Copyright © 2004 The McGraw-Hill Companies. All rights reserved.
Any use is subject to the Terms of Use as given at the website.