
Page 140 - Physical Principles of Sedimentary Basin Analysis
P. 140
122 Heat flow
slope z 0
0.10
0.08
heat flow [W/m 2 ] 0.06
0.04
qm
0.02
0 2 4 6 8 10
3
heat production [μW/m ]
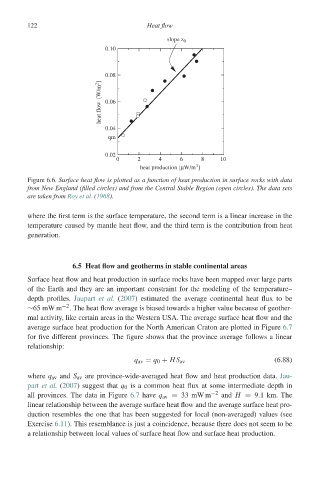
Figure 6.6. Surface heat flow is plotted as a function of heat production in surface rocks with data
from New England (filled circles) and from the Central Stable Region (open circles). The data sets
are taken from Roy et al. (1968).
where the first term is the surface temperature, the second term is a linear increase in the
temperature caused by mantle heat flow, and the third term is the contribution from heat
generation.
6.5 Heat flow and geotherms in stable continental areas
Surface heat flow and heat production in surface rocks have been mapped over large parts
of the Earth and they are an important constraint for the modeling of the temperature–
depth profiles. Jaupart et al. (2007) estimated the average continental heat flux to be
∼65 mW m −2 . The heat flow average is biased towards a higher value because of geother-
mal activity, like certain areas in the Western USA. The average surface heat flow and the
average surface heat production for the North American Craton are plotted in Figure 6.7
for five different provinces. The figure shows that the province average follows a linear
relationship:
q av = q 0 + HS av (6.88)
where q av and S av are province-wide-averaged heat flow and heat production data. Jau-
part et al. (2007) suggest that q 0 is a common heat flux at some intermediate depth in
all provinces. The data in Figure 6.7 have q av = 33 mW m −2 and H = 9.1km.The
linear relationship between the average surface heat flow and the average surface heat pro-
duction resembles the one that has been suggested for local (non-averaged) values (see
Exercise 6.11). This resemblance is just a coincidence, because there does not seem to be
a relationship between local values of surface heat flow and surface heat production.