
Page 141 - Physical Principles of Sedimentary Basin Analysis
P. 141
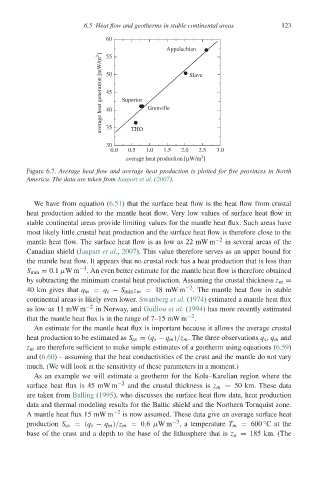
6.5 Heat flow and geotherms in stable continental areas  123

                                 60
                                                  Appalachian
                                average heat generation [mW/m 2 ]   50  Superior  Grenville  Slave
                                 55


                                 45


                                 40
                                 35


                                 30     THO
                                   0.0  0.5  1.0  1.5  2.0  2.5  3.0
                                                           3
                                       average heat production [μW/m ]
            Figure 6.7. Average heat flow and average heat production is plotted for five provinces in North
            America. The data are taken from Jaupart et al. (2007).


              We have from equation (6.51) that the surface heat flow is the heat flow from crustal
            heat production added to the mantle heat flow. Very low values of surface heat flow in
            stable continental areas provide limiting values for the mantle heat flux. Such areas have
            most likely little crustal heat production and the surface heat flow is therefore close to the
            mantle heat flow. The surface heat flow is as low as 22 mW m −2  in several areas of the
            Canadian shield (Jaupart et al., 2007). This value therefore serves as an upper bound for
            the mantle heat flow. It appears that no crustal rock has a heat production that is less than
            S min = 0.1 μWm −3 . An even better estimate for the mantle heat flow is therefore obtained
            by subtracting the minimum crustal heat production. Assuming the crustal thickness z m =
            40 km gives that q m = q s − S min z m = 18 mW m −2 . The mantle heat flow in stable
            continental areas is likely even lower. Swanberg et al. (1974) estimated a mantle heat flux
            as low as 11 mW m −2  in Norway, and Guillou et al. (1994) has more recently estimated
            that the mantle heat flux is in the range of 7–15 mW m −2 .
              An estimate for the mantle heat flux is important because it allows the average crustal
            heat production to be estimated as S av = (q s − q m )/z m . The three observations q s , q m and
            z m are therefore sufficient to make simple estimates of a geotherm using equations (6.59)
            and (6.60) – assuming that the heat conductivities of the crust and the mantle do not vary
            much. (We will look at the sensitivity of these parameters in a moment.)
              As an example we will estimate a geotherm for the Kola–Karelian region where the
            surface heat flux is 45 mW m −2  and the crustal thickness is z m = 50 km. These data
            are taken from Balling (1995), who discusses the surface heat flow data, heat production
            data and thermal modeling results for the Baltic shield and the Northern Tornquist zone.
            A mantle heat flux 15 mW m −2  is now assumed. These data give an average surface heat
                                                                            ◦
            production S av = (q s − q m )/z m = 0.6 μWm −3 , a temperature T m = 600 Catthe
            base of the crust and a depth to the base of the lithosphere that is z a = 185 km. (The