
Page 157 - Physical Principles of Sedimentary Basin Analysis
P. 157
6.10 Heat flow and salt domes 139
0
10
20
30
40
1 50 60
[km] 60 Shale
depth 70 Sandstone
80
2
90 Salt
100
110
3
0 2 4 6 8 10
x−coordinate [km]
(a)
65
surface heat flow [mW/m 2 ] 55
60
50
45
40
0 2 4 6 8 10
x−coordinate [km]
(b)
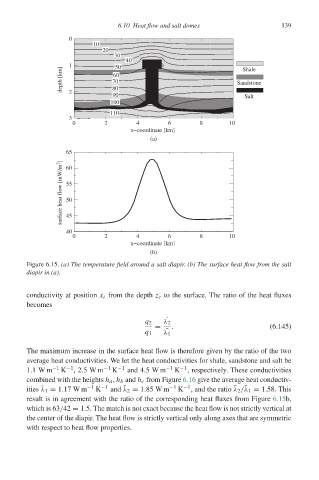
Figure 6.15. (a) The temperature field around a salt diapir. (b) The surface heat flow from the salt
diapir in (a).
conductivity at position x i from the depth z c to the surface. The ratio of the heat fluxes
becomes
q 2 ¯ λ 2
= . (6.145)
¯
q 1 λ 1
The maximum increase in the surface heat flow is therefore given by the ratio of the two
average heat conductivities. We let the heat conductivities for shale, sandstone and salt be
1.1W m −1 K −1 ,2.5W m −1 K −1 and 4.5W m −1 K −1 , respectively. These conductivities
combined with the heights h a , h b and h c from Figure 6.16 give the average heat conductiv-
ities ¯ λ 1 = 1.17 W m −1 K −1 and ¯ λ 2 = 1.85 W m −1 K −1 , and the ratio ¯ λ 2 / ¯ λ 1 = 1.58. This
result is in agreement with the ratio of the corresponding heat fluxes from Figure 6.15b,
which is 63/42 = 1.5. The match is not exact because the heat flow is not strictly vertical at
the center of the diapir. The heat flow is strictly vertical only along axes that are symmetric
with respect to heat flow properties.