
Page 161 - Physical Principles of Sedimentary Basin Analysis
P. 161
6.11 Forced convective heat transfer 143
1.0
Pe = 10
0.8
Pe = 1
Pe = −1
0.6 Pe = 0.1
z [−] Pe = −0.1 Pe = 0
^
0.4
0.2
Pe=−10
0.0
0.0 0.2 0.4 0.6 0.8 1.0
^
T [−]
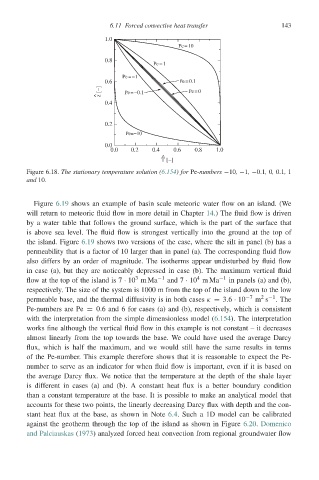
Figure 6.18. The stationary temperature solution (6.154)for Pe-numbers −10, −1, −0.1, 0, 0.1, 1
and 10.
Figure 6.19 shows an example of basin scale meteoric water flow on an island. (We
will return to meteoric fluid flow in more detail in Chapter 14.) The fluid flow is driven
by a water table that follows the ground surface, which is the part of the surface that
is above sea level. The fluid flow is strongest vertically into the ground at the top of
the island. Figure 6.19 shows two versions of the case, where the silt in panel (b) has a
permeability that is a factor of 10 larger than in panel (a). The corresponding fluid flow
also differs by an order of magnitude. The isotherms appear undisturbed by fluid flow
in case (a), but they are noticeably depressed in case (b). The maximum vertical fluid
3
4
flow at the top of the island is 7 · 10 mMa −1 and 7 · 10 mMa −1 in panels (a) and (b),
respectively. The size of the system is 1000 m from the top of the island down to the low
2 −1
permeable base, and the thermal diffusivity is in both cases κ = 3.6 · 10 −7 m s .The
Pe-numbers are Pe = 0.6 and 6 for cases (a) and (b), respectively, which is consistent
with the interpretation from the simple dimensionless model (6.154). The interpretation
works fine although the vertical fluid flow in this example is not constant – it decreases
almost linearly from the top towards the base. We could have used the average Darcy
flux, which is half the maximum, and we would still have the same results in terms
of the Pe-number. This example therefore shows that it is reasonable to expect the Pe-
number to serve as an indicator for when fluid flow is important, even if it is based on
the average Darcy flux. We notice that the temperature at the depth of the shale layer
is different in cases (a) and (b). A constant heat flux is a better boundary condition
than a constant temperature at the base. It is possible to make an analytical model that
accounts for these two points, the linearly decreasing Darcy flux with depth and the con-
stant heat flux at the base, as shown in Note 6.4. Such a 1D model can be calibrated
against the geotherm through the top of the island as shown in Figure 6.20. Domenico
and Palciauskas (1973) analyzed forced heat convection from regional groundwater flow