Page 192 - Physical Principles of Sedimentary Basin Analysis
P. 192

174                             Heat flow
                        √
                 exp(−ˆz/ 2). It follows that the amplitude is reduced by the factor 1/e ≈ 0.36 at the depth
                     √                                          √
                 ˆ z =  2 ≈ 1.41 and by the factor 0.01 at the depth ˆz =− 2ln(0.01) ≈ 6.5. The depth
                     √
                 ˆ z =  2 is called the skin depth. Another point is that the subsurface lags behind the sur-
                                                                        √
                 face. The depth z reaches its temperature maximum at time  ˆ t =ˆz/ 2 after the surface,
                                                 √
                 and the temperature at the depth ˆz =  2π ≈ 4.44 is in opposite phase to the surface
                 temperature. The temperature is at its maximum at this depth when the temperature at the
                 surface is at its minimum.
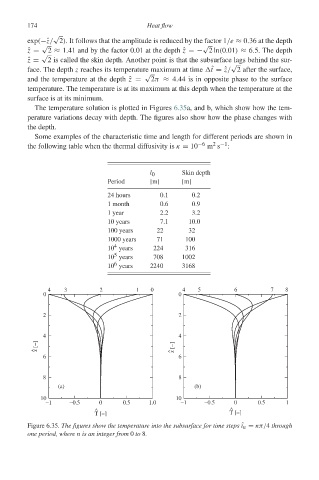
                   The temperature solution is plotted in Figures 6.35a, and b, which show how the tem-
                 perature variations decay with depth. The figures also show how the phase changes with
                 the depth.
                   Some examples of the characteristic time and length for different periods are shown in
                                                                   2 −1
                 the following table when the thermal diffusivity is κ = 10 −6  m s  :


                                                  l 0      Skin depth
                                       Period     [m]      [m]
                                       24 hours      0.1      0.2
                                       1 month       0.6      0.9
                                       1 year        2.2      3.2
                                       10 years      7.1     10.0
                                       100 years    22       32
                                       1000 years   71      100
                                        4
                                       10 years    224      316
                                        5
                                       10 years    708     1002
                                        6
                                       10 years   2240     3168
                       4   3         2        1   0        4   5         6         7   8
                     0                                    0

                     2                                    2


                     4                                    4
                    z [−]                                z [−]
                   ^                                    ^
                     6                                    6


                     8                                    8
                         (a)                                  (b)
                     10                                  10
                      −1    −0.5    0      0.5    1.0     −1     −0.5    0     0.5     1
                                   ^                                    ^
                                   T [−]                                T [−]
                 Figure 6.35. The figures show the temperature into the subsurface for time steps ˆ t n = nπ/4 through
                 one period, where n is an integer from 0 to 8.
   187   188   189   190   191   192   193   194   195   196   197