
Page 35 - Physical Principles of Sedimentary Basin Analysis
P. 35
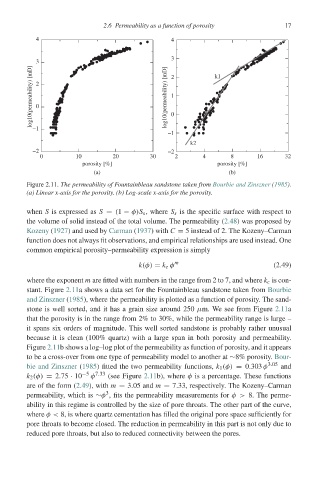
2.6 Permeability as a function of porosity       17

              4                                    4

                                                   3
              3                                    2           k1
             log10(permeability) [mD]   2 0       log10(permeability) [mD]  1


             −1                                    0
                                                  −1
                                                        k2
             −2                                   −2
               0         10        20        30     2       4      8      16      32
                           porosity [%]                         porosity [%]
                              (a)                                  (b)
            Figure 2.11. The permeability of Fountainbleau sandstone taken from Bourbie and Zinszner (1985).
            (a) Linear x-axis for the porosity. (b) Log-scale x-axis for the porosity.

            when S is expressed as S = (1 − φ)S s , where S s is the specific surface with respect to
            the volume of solid instead of the total volume. The permeability (2.48) was proposed by
            Kozeny (1927) and used by Carman (1937) with C = 5 instead of 2. The Kozeny–Carman
            function does not always fit observations, and empirical relationships are used instead. One
            common empirical porosity–permeability expression is simply

                                          k(φ) = k c φ m                       (2.49)
            where the exponent m are fitted with numbers in the range from 2 to 7, and where k c is con-
            stant. Figure 2.11a shows a data set for the Fountainbleau sandstone taken from Bourbie
            and Zinszner (1985), where the permeability is plotted as a function of porosity. The sand-
            stone is well sorted, and it has a grain size around 250 μm. We see from Figure 2.11a
            that the porosity is in the range from 2% to 30%, while the permeability range is large –
            it spans six orders of magnitude. This well sorted sandstone is probably rather unusual
            because it is clean (100% quartz) with a large span in both porosity and permeability.
            Figure 2.11b shows a log–log plot of the permeability as function of porosity, and it appears
            to be a cross-over from one type of permeability model to another at ∼8% porosity. Bour-
            bie and Zinszner (1985) fitted the two permeability functions, k 1 (φ) = 0.303 φ 3.05  and
            k 2 (φ) = 2.75 · 10 −5  φ 7.33  (see Figure 2.11b), where φ is a percentage. These functions
            are of the form (2.49), with m = 3.05 and m = 7.33, respectively. The Kozeny–Carman
                                 3
            permeability, which is ∼φ , fits the permeability measurements for φ> 8. The perme-
            ability in this regime is controlled by the size of pore throats. The other part of the curve,
            where φ< 8, is where quartz cementation has filled the original pore space sufficiently for
            pore throats to become closed. The reduction in permeability in this part is not only due to
            reduced pore throats, but also to reduced connectivity between the pores.