
Page 37 - Physical Principles of Sedimentary Basin Analysis
P. 37
2.7 Empirical permeability relationships 19
where k c = exp(b) is the permeability at zero porosity. Another possibility is to write the
permeability as
k(φ) = k 0 exp a(φ − φ 0 ) (2.52)
where k 0 = exp(b + aφ 0 ) is the permeability at a reference porosity φ 0 . The permeability
a controls how strongly the permeability depends on the porosity, and the parameter b
is just ln(k c ). The linear fit to the log-values of the permeability is common with respect
to different types of lithologies, clay, shale and carbonate rocks, not just sandstones as in
Figure 2.12.
We have so far only looked at permeabilities for sandstones. It is a much studied lithol-
ogy with respect to petrophysical properties because oil and gas reservoirs are often found
in sandstones. Shales on the other hand are much less studied with respect to permeability,
although it is commonly the dominating lithology in sedimentary units. Their very low per-
meability is one reason why there are so few measurements. It is difficult to measure since
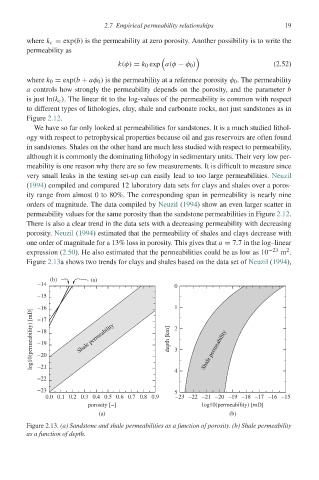
very small leaks in the testing set-up can easily lead to too large permeabilities. Neuzil
(1994) compiled and compared 12 laboratory data sets for clays and shales over a poros-
ity range from almost 0 to 80%. The corresponding span in permeability is nearly nine
orders of magnitude. The data compiled by Neuzil (1994) show an even larger scatter in
permeability values for the same porosity than the sandstone permeabilities in Figure 2.12.
There is also a clear trend in the data sets with a decreasing permeability with decreasing
porosity. Neuzil (1994) estimated that the permeability of shales and clays decrease with
one order of magnitude for a 13% loss in porosity. This gives that a = 7.7 in the log–linear
2
expression (2.50). He also estimated that the permeabilities could be as low as 10 −23 m .
Figure 2.13a shows two trends for clays and shales based on the data set of Neuzil (1994),
(b) (a)
−14 0
−15
−16 1
log10(permeability) [mD] −18 Shale permeability depth [km] 2 3 Shale permeability
−17
−19
−20
−21
4
−22
−23 5
0.0 0.1 0.2 0.3 0.4 0.5 0.6 0.7 0.8 0.9 −23 −22 −21 −20 −19 −18 −17 −16 −15
porosity [−] log10(permeability) [mD]
(a) (b)
Figure 2.13. (a) Sandstone and shale permeabilities as a function of porosity. (b) Shale permeability
as a function of depth.