
Page 36 - Physical Principles of Sedimentary Basin Analysis
P. 36
18 Properties of porous media
Nelson (2004b) discusses alternative porosity–permeability models for sedimentary
rocks in the light of a number of porosity–permeability studies. Nelson (2005) discusses
the importance of the pore throat size in addition to the porosity as a parameter controlling
the permeability.
2.7 Empirical permeability relationships
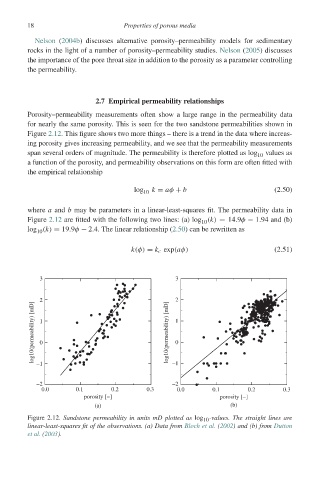
Porosity–permeability measurements often show a large range in the permeability data
for nearly the same porosity. This is seen for the two sandstone permeabilities shown in
Figure 2.12. This figure shows two more things – there is a trend in the data where increas-
ing porosity gives increasing permeability, and we see that the permeability measurements
span several orders of magnitude. The permeability is therefore plotted as log 10 values as
a function of the porosity, and permeability observations on this form are often fitted with
the empirical relationship
log 10 k = aφ + b (2.50)
where a and b may be parameters in a linear-least-squares fit. The permeability data in
Figure 2.12 are fitted with the following two lines: (a) log (k) = 14.9φ − 1.94 and (b)
10
log (k) = 19.9φ − 2.4. The linear relationship (2.50) can be rewritten as
10
k(φ) = k c exp(aφ) (2.51)
3 3
2 2
log10(permeability) [mD] 1 0 log10(permeability) [mD] 1 0
−1 −1
−2 −2
0.0 0.1 0.2 0.3 0.0 0.1 0.2 0.3
porosity [−] porosity [−]
(a) (b)
Figure 2.12. Sandstone permeability in units mD plotted as log -values. The straight lines are
10
linear-least-squares fit of the observations. (a) Data from Bloch et al. (2002) and (b) from Dutton
et al. (2003).