
Page 84 - Physical chemistry understanding our chemical world
P. 84
QUANTIFYING THE INTERACTIONS AND THEIR INFLUENCE 51
75
74
Applied pressure/p O 73 31.523°
31.013°
72
30.409°
71
29.929°
32 36 40 44 48 52 56 60 64
3
Molar volume/cm mol −1
◦
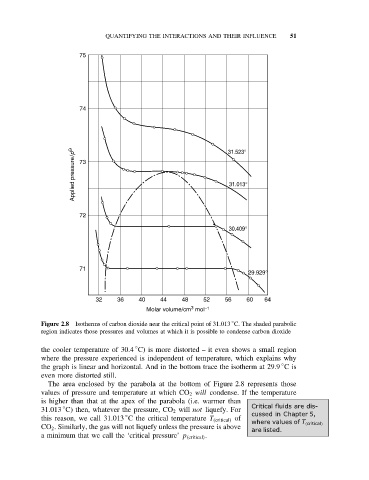
Figure 2.8 Isotherms of carbon dioxide near the critical point of 31.013 C. The shaded parabolic
region indicates those pressures and volumes at which it is possible to condense carbon dioxide
◦
the cooler temperature of 30.4 C) is more distorted – it even shows a small region
where the pressure experienced is independent of temperature, which explains why
◦
the graph is linear and horizontal. And in the bottom trace the isotherm at 29.9 Cis
even more distorted still.
The area enclosed by the parabola at the bottom of Figure 2.8 represents those
values of pressure and temperature at which CO 2 will condense. If the temperature
is higher than that at the apex of the parabola (i.e. warmer than
◦
31.013 C) then, whatever the pressure, CO 2 will not liquefy. For Critical fluids are dis-
◦
this reason, we call 31.013 C the critical temperature T (critical) of cussed in Chapter 5,
where values of T (critical)
CO 2 . Similarly, the gas will not liquefy unless the pressure is above
are listed.
a minimum that we call the ‘critical pressure’ p (critical) .