
Page 86 - Physical chemistry understanding our chemical world
P. 86
QUANTIFYING THE INTERACTIONS AND THEIR INFLUENCE 53
2.0
H 2
1.5
Compressibility factor Z 1.0 N 2
2 4
0.5 CH 4 C H NH 3
0
0 200 400 600 800 1000 1200
Applied pressure/p O
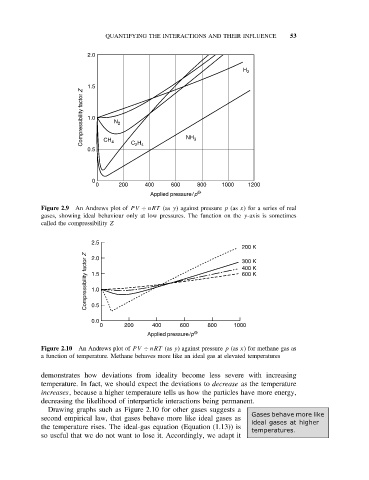
Figure 2.9 An Andrews plot of PV ÷ nRT (as y) against pressure p (as x) for a series of real
gases, showing ideal behaviour only at low pressures. The function on the y-axis is sometimes
called the compressibility Z
2.5
200 K
Compressibility factor Z 1.5 400 K
2.0
300 K
600 K
1.0
0.5
0.0
0 200 400 600 800 1000
Applied pressure/p O
Figure 2.10 An Andrews plot of PV ÷ nRT (as y) against pressure p (as x) for methane gas as
a function of temperature. Methane behaves more like an ideal gas at elevated temperatures
demonstrates how deviations from ideality become less severe with increasing
temperature. In fact, we should expect the deviations to decrease as the temperature
increases, because a higher temperature tells us how the particles have more energy,
decreasing the likelihood of interparticle interactions being permanent.
Drawing graphs such as Figure 2.10 for other gases suggests a
Gases behave more like
second empirical law, that gases behave more like ideal gases as
ideal gases at higher
the temperature rises. The ideal-gas equation (Equation (1.13)) is
temperatures.
so useful that we do not want to lose it. Accordingly, we adapt it