
Page 28 - Physical chemistry eng
P. 28
1.2 THE MACROSCOPIC VARIABLES VOLUME, PRESSURE, AND TEMPERATURE 5
The simplest case that one can imagine is when T is linearly related to the value of
Ambient temperature
the thermometric property x: 12 4
10 K 10 s after Big Bang
T(x) = a + bx (1.12)
Equation (1.12) defines a temperature scale in terms of a specific thermometric prop- 10 10 K
erty, once the constants a and b are determined. The constant a determines the zero of
the temperature scale because T(0) = a and the constant b determines the size of a Core of red giant star
unit of temperature, called a degree. 10 K
8
One of the first practical thermometers was the mercury-in-glass thermometer. This Core of sun
thermometer utilizes the thermometric property that the volume of mercury increases
Solar corona
monotonically over the temperature range –38.8°C to 356.7°C in which Hg is a liquid. 10 K
6
In 1745, Carolus Linnaeus gave this thermometer a standardized scale by arbitrarily
assigning the values 0 and 100 to the freezing and boiling points of water, respectively.
Because there are 100 degrees between the two calibration points, this scale is known 10 K Surface of sun
4
as the centigrade scale. Mercury boils
The centigrade scale has been superseded by the Celsius scale. The Celsius scale
H 2 O is liquid
(denoted in units of °C) is similar to the centigrade scale. However, rather than being 10 K
2
determined by two fixed points, the Celsius scale is determined by one fixed reference Oxygen boils
point at which ice, liquid water, and gaseous water are in equilibrium. This point is Helium boils
called the triple point (see Section 8.2) and is assigned the value 0.01°C. On the Celsius 1 K
scale, the boiling point of water at a pressure of 1 atmosphere is 99.975°C. The size of Average temperature
of universe
the degree is chosen to be the same as on the centigrade scale.
Although the Celsius scale is used widely throughout the world today, the numeri- 10 2 K
cal values for this temperature scale are completely arbitrary, because a liquid other
than water could have been chosen as a reference. It would be preferable to have a tem- 3 He superfluid
perature scale derived directly from physical principles. There is such a scale, called 10 4 K
the thermodynamic temperature scale or absolute temperature scale. For such a
scale, the temperature is independent of the substance used in the thermometer, and the
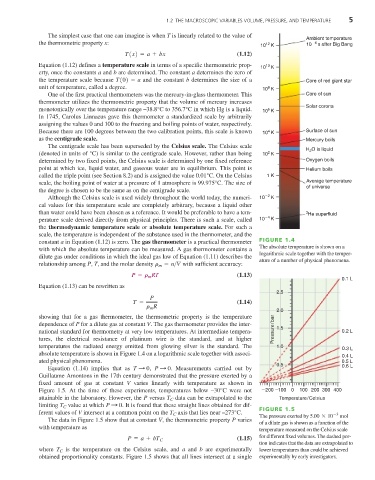
constant a in Equation (1.12) is zero. The gas thermometer is a practical thermometer FIGURE 1.4
with which the absolute temperature can be measured. A gas thermometer contains a The absolute temperature is shown on a
logarithmic scale together with the temper-
dilute gas under conditions in which the ideal gas law of Equation (1.11) describes the
ature of a number of physical phenomena.
relationship among P, T, and the molar density r m = n>V with sufficient accuracy:
P = r RT (1.13)
m
0.1 L
Equation (1.13) can be rewritten as
2.5
P
T = (1.14)
r R
m
2.0
showing that for a gas thermometer, the thermometric property is the temperature
dependence of P for a dilute gas at constant V. The gas thermometer provides the inter- 1.5
national standard for thermometry at very low temperatures. At intermediate tempera- Pressure/bar 0.2 L
tures, the electrical resistance of platinum wire is the standard, and at higher
temperatures the radiated energy emitted from glowing silver is the standard. The 1.0
0.3 L
absolute temperature is shown in Figure 1.4 on a logarithmic scale together with associ-
0.4 L
ated physical phenomena. 0.5 L
0.5 0.6 L
Equation (1.14) implies that as T : 0 , P : 0 . Measurements carried out by
Guillaume Amontons in the 17th century demonstrated that the pressure exerted by a
fixed amount of gas at constant V varies linearly with temperature as shown in
Figure 1.5. At the time of these experiments, temperatures below –30°C were not 200 100 0 100 200 300 400
attainable in the laboratory. However, the P versus T data can be extrapolated to the Temperature/Celsius
C
limiting T value at which P : 0 . It is found that these straight lines obtained for dif-
C
ferent values of V intersect at a common point on the T axis that lies near –273°C. FIGURE 1.5 -3
C
The pressure exerted by 5.00 * 10 mol
The data in Figure 1.5 show that at constant V, the thermometric property P varies
of a dilute gas is shown as a function of the
with temperature as
temperature measured on the Celsius scale
P = a + bT C (1.15) for different fixed volumes. The dashed por-
tion indicates that the data are extrapolated to
is the temperature on the Celsius scale, and a and b are experimentally
where T C lower temperatures than could be achieved
obtained proportionality constants. Figure 1.5 shows that all lines intersect at a single experimentally by early investigators.