Page 266 - Physical Chemistry
P. 266

lev38627_ch08.qxd  3/14/08  12:54 PM  Page 247


                                                                                                                 247
                  Redlich–Kwong with the parameters a and b taken as functions of the mixture’s com-          Section 8.3
                  position. For a mixture of two gases, 1 and 2, one often takes                             Condensation

                                                        2
                                   2
                              a   x a   2x x 1a a 2  1>2    x a   and  b   x b   x b  (8.10)
                                   1 1
                                                                             2 2
                                          1 2
                                                        2 2
                                               1 2
                                                                      1 1
                  where x and x are the mole fractions of the components. b is related to the molecu-
                         1
                               2
                  lar size, so b is taken as a weighted average of b and b . The parameter a is related to
                                                                 2
                                                           1
                  intermolecular attractions. The quantity (a a ) 1/2  is an estimate of what the intermo-
                                                       1 2
                  lecular interaction between gas 1 and gas 2 molecules might be. In applying an equa-
                  tion of state to a mixture, V is interpreted as the mean molar volume of the system,
                                         m
                  defined by
                                                 V   V>n  tot                        (8.11)
                                                   m
                      For the virial equation of state, the second virial coefficient for a mixture of two
                               2
                                                2
                  gases is B   x B   2x x B   x B , where B is best determined from experimen-
                                                          12
                                 1
                                               2 2
                                      1 2 12
                               1
                                                                       1
                  tal data on the mixture, but can be crudely estimated as B   (B   B ).
                                                                               2
                                                                          1
                                                                       2
                                                                   12
                      The mixing rule (8.10) works well only if the molecules of gases 1 and 2 are similar (for
                      example, two hydrocarbons). To improve performance, a in (8.10) is often modified to a
                                                  2
                         2
                        x a   2x x (1   k )(a a ) 1/2    x a , where k is a constant whose value is found by
                         1 1
                                       12
                                1 2
                                                            12
                                                    2
                                          1 2
                      fitting experimental data for gases 1 and 2 and differs for different pairs of gases. Many
                      other mixing rules have been proposed [see P. Ghosh,  Chem. Eng. Technol., 22, 379
                      (1999)].
                    8.3          CONDENSATION
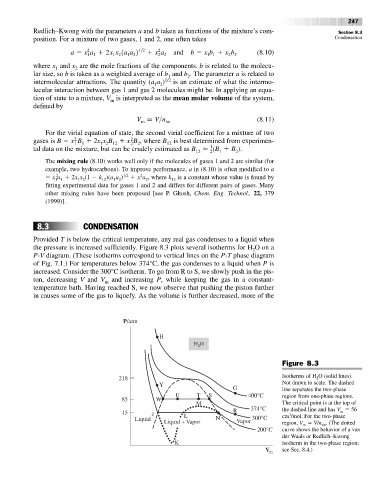
                  Provided T is below the critical temperature, any real gas condenses to a liquid when
                  the pressure is increased sufficiently. Figure 8.3 plots several isotherms for H O on a
                                                                                    2
                  P-V diagram. (These isotherms correspond to vertical lines on the P-T phase diagram
                  of Fig. 7.1.) For temperatures below 374°C, the gas condenses to a liquid when P is
                  increased. Consider the 300°C isotherm. To go from R to S, we slowly push in the pis-
                  ton, decreasing  V and  V and increasing  P, while keeping the gas in a constant-
                                        m
                  temperature bath. Having reached S, we now observe that pushing the piston further
                  in causes some of the gas to liquefy. As the volume is further decreased, more of the
                                             P/atm
                                                        H
                                                                  H 2 O
                                                                                             Figure 8.3
                                            218                                              Isotherms of H O (solid lines).
                                                                                                       2
                                                        Y                                    Not drawn to scale. The dashed
                                                                              G              line separates the two-phase
                                                             U     T   S           400°C     region from one-phase regions.
                                             85        W
                                                                   M                         The critical point is at the top of
                                                                                                              m
                                             15       J        L              R    374°C     the dashed line and has V   56
                                                                                               3
                                                                                             cm /mol. For the two-phase
                                                 Liquid                  N          300°C
                                                          Liquid + Vapor       Vapor         region, V   V/n . (The dotted
                                                                                                   m
                                                                                                         tot
                                                                                     200°C   curve shows the behavior of a van
                                                                                             der Waals or Redlich–Kwong
                                                             K                               isotherm in the two-phase region;
                                                                                             see Sec. 8.4.)
                                                                                        V m
   261   262   263   264   265   266   267   268   269   270   271