
Page 295 - Physical Chemistry
P. 295
lev38627_ch09.qxd 3/14/08 1:31 PM Page 276
276
Chapter 9 The closest resemblance occurs for isotopic species; for example, a mixture of
13
Solutions 12 CH I and CH I. [Strictly speaking, even here there would be very slight departures
3
3
from ideal behavior. The difference in isotopic masses leads to a difference in the mag-
nitudes of molecular zero-point vibrations (Chapter 20), which causes the bond
lengths and the dipole moments of the two isotopic species to differ very slightly.
Hence the molecular sizes and intermolecular forces will differ very slightly for
the isotopic species.] Apart from isotopic species, there are some pairs of liquids
for which we would expect quite similar B-B, B-C, and C-C intermolecular interac-
tions and quite similar B and C molecular volumes and hence would expect nearly
ideal-solution behavior. Examples include benzene–toluene, n-C H –n-C H ,
16
7
8
18
C H Cl–C H Br, and C(CH ) –Si(CH ) .
3 4
3 4
5
2
5
2
The ideal-solution model serves as a reference point for discussing the behavior
of real solutions. Deviations from ideal-solution behavior are due to differing B-B,
B-C, and C-C intermolecular forces and to differing sizes and shapes of the B and C
molecules, and these deviations can tell us something about the intermolecular inter-
actions in the solution.
The preceding molecular definition of an ideal solution is not acceptable in ther-
modynamics, which is a macroscopic science. To arrive at a thermodynamic definition
of an ideal solution, we examine mix G data. One finds that, when two liquids B and
C whose molecules resemble each other closely are mixed at constant T and P, the ex-
perimental mix G data (as found from vapor-pressure measurements—Sec. 9.3) satisfy
the following equation for all solution compositions:
¢ mix G RT1n ln x n ln x 2 ideal soln., const. T, P (9.39)
C
B
C
B
where n , n , x , and x are the mole numbers and mole fractions of B and C in the
B
C
C
B
solution and R is the gas constant. For example, mix G data for solutions of cyclopen-
tane (C H ) plus cyclohexane (C H ) at 25°C and 1 atm as compared with the ideal-
5
6
12
10
solution values mix G calculated from (9.39) are [M. B. Ewing and K. N. Marsh, J.
id
Chem. Thermodyn., 6, 395 (1974)]:
x 0.1 0.2 0.3 0.4 0.5 0.6 0.8
C 6 H 12
( mix G/n)/(J/mol) 807 1242 1517 1672 1722 1672 1242
( mix G /n)/(J/mol) 806 1240 1514 1668 1718 1668 1240
id
2
where n n n . For a solution of C H plus C D (where D H) with x
C B 6 6 6 6 C 6 H 6
0.5, experimental versus ideal-solution G values at various temperatures are [G.
mix
Jakli et al., J. Chem. Phys., 68, 3177 (1978)]:
t 10°C 25°C 50°C 80°C
( G/n)/(J/mol) 1631.2 1717.7 1861.8 2034.7
mix
id
( G /n)/(J/mol) 1631.8 1718.3 1862.3 2035.2
mix
We can show why (9.39) would very likely hold for ideal solutions. From the mo-
lecular definition, it is clear that formation of an ideal solution from the pure compo-
nents at constant T and P is accompanied by no change in energy or volume: U
mix
0 and V 0. Therefore H U P V 0.
mix mix mix mix
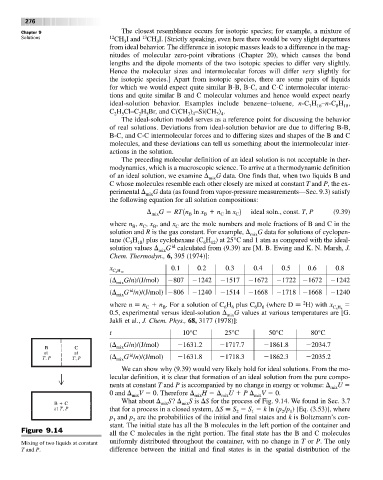
What about S? S is S for the process of Fig. 9.14. We found in Sec. 3.7
mix mix
that for a process in a closed system, S S S k ln (p /p ) [Eq. (3.53)], where
2 1 2 1
p and p are the probabilities of the initial and final states and k is Boltzmann’s con-
1 2
stant. The initial state has all the B molecules in the left portion of the container and
Figure 9.14
all the C molecules in the right portion. The final state has the B and C molecules
Mixing of two liquids at constant uniformly distributed throughout the container, with no change in T or P. The only
T and P. difference between the initial and final states is in the spatial distribution of the