
Page 168 - Pipeline Risk Management Manual Ideas, Techniques, and Resources
P. 168
Leakvolume 11145
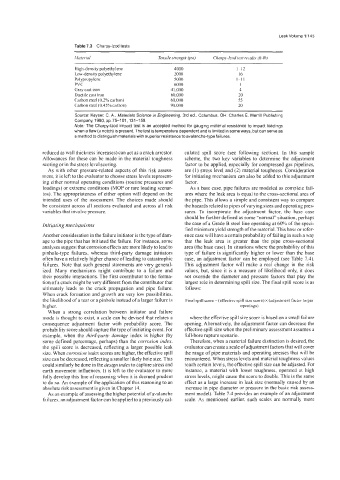
Table 7.3 Charpy-lzod tests
Muteriul Tensile srrength (psi) Charpy-lzod lest result.\ (ft-lhJ
High-density polyethylene 4000 I -I2
Low-density polyethylene 2000 16
Polypropylene 5000 1-1 I
PVC 6000 I
Gray cast iron 4 1,000 4
Ductile cast iron 60,000 20
Carbon steel (0.2% carbon) 60,000 55
Carbon steel (0.45% carbon) 90.000 20
Source: Keyser, C. A , Materials Science in Engineering, 3rd ed., Columbus, OH: Charles E. Merrill Publishing
Company, 1980. pp. 75-101,131-159.
Note: The Charpy-lzod impact test is an accepted method for gauging material resistance to impact loadings
when a flaw (a notch) is present. The test is temperature dependent and is limited in some ways, but can serve as
a method to distinguish materials with superior resistance to avalanche-type failures.
reduced as wall thickness increases) can act as a crack arrestor. culated spill score (see following section). In this sample
Allowances for these can be made in the material toughness scheme, the two key variables to determine the adjustment
scoring or in the stress level scoring. factor to be applied, especially for compressed gas pipelines,
As with other pressure-related aspects of this risk assess- are (1) stress level and (2) material toughness. Consideration
ment, it is left to the evaluator to choose stress levels represent- for initiating mechanism can also be added to this adjustment
ing either normal operating conditions (routine pressures and factor.
loadings) or extreme conditions (MOP or rare loading scenar- As a base case, pipe failures are modeled as complete fail-
ios). The appropriateness of either option will depend on the ures where the leak area is equal to the cross-sectional area of
intended uses of the assessment. The choices made should the pipe. This allows a simple and consistent way to compare
be consistent across all sections evaluated and across all risk the hazards related to pipes of varying sizes and operating pres-
variables that involve pressure. sures. To incorporate the adjustment factor, the base case
should be further defined as some “normal” situation, perhaps
Initiating mechanisms the case of a Grade B steel line operating at 60% of the speci-
fied minimum yield strength ofthe material. This base or refer-
Another consideration in the failure initiator is the type of dam- ence case will have a certain probability of failing in such a way
age to the pipe that has initiated the failure. For instance, some that the leak area is greater than the pipe cross-sectional
analyses suggest that corrosion effects are more likely to lead to area (the base case). In situations where the probability of this
pinhole-type failures, whereas third-party damage initiators type of failure is significantly higher or lower than the base
often have a relatively higher chance of leading to catastrophic case, an adjustment factor can be employed (see Table 7.4).
failures. Note that such general statements are very general- This adjustment factor will make a real change in the risk
ized. Many mechanisms might contribute to a failure and values, but, since it is a measure of likelihood only, it does
their possible interactions. The first contributor to the forma- not override the diameter and pressure factors that play the
tion of a crack might be very different from the contributor that largest role in determining spill size. The final spill score is as
ultimately leads to the crack propagation and pipe failure. follows:
When crack formation and growth are very low possibilities,
the likelihood of a tear or a pinhole instead of a larger failure is Final spill score = (effective spill size score) x (adjustment factor larger
higher. openings)
When a strong correlation between initiator and failure
mode is thought to exist, a scale can be devised that relates a where the effective spill size score is based on a small failure
consequence adjustment factor with probability score. The opening. Alternatively, the adjustment factor can decrease the
probability score should capture the type of initiating event. For effective spill size when the preliminary assessment assumes a
example, when the third-party damage index is higher (by full-bore rupture scenario.
some defined percentage, perhaps) than the corrosion index, Therefore, when a material failure distinction is desired, the
the spill score is decreased, reflecting a larger possible leak evaluator can create a scale ofadjustment factors that will cover
size. When corrosion index scores are higher, the effective spill the range of pipe materials and operating stresses that will be
size can be decreased, reflecting a smaller likely hole size. This encountered. When stress levels and material toughness values
could similarly be done in the design index to capture stress and reach certain levels, the effective spill size can be adjusted. For
earth movement influences. It is left to the evaluator to more instance, a material with lower toughness, operated at high
fully develop this line of reasoning when it is deemed prudent stress levels, might cause the score to double. This is the same
to do so. An example of the application of this reasoning to an effect as a large increase in leak size (normally caused by an
absolute risk assessment is given in Chapter 14. increase in pipe diameter or pressure in the basic risk assess-
As an example of assessing the higher potential of avalanche ment model). Table 7.4 provides an example of an adjustment
failures. an adjustment factor can be applied to apreviously cal- scale. As mentioned earlier, such scales are normally more