
Page 169 - Pipeline Risk Management Manual Ideas, Techniques, and Resources
P. 169
7/146 Leak Impact Factor
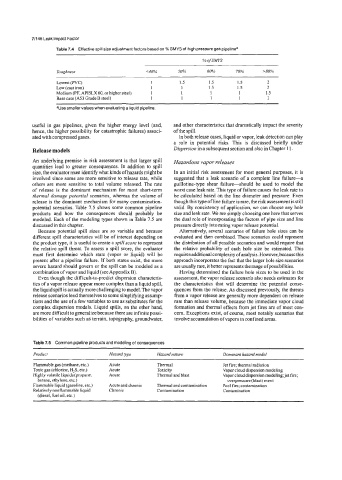
Table 7.4 Effective spill size adjustment factors based on Oh SMYS of high pressure gas pipeline'
% of SMYS
-~ ~~ ~~
Toughness <40% 50% 60% 70% >80%
Lowest (PVC) 1 1.5 1.5 1.5 2
Low (cast iron) 1 I I .5 1.5 2
Medium (PE, APISLX 60, or higher steel) 1 1 1 1 1.5
Base case (A53 Grade B steel) 1 1 1 1 1
aUse smaller values when evaluating a liquid pipeline
useful in gas pipelines, given the higher energy level (and, and other characteristics that dramatically impact the severity
hence, the higher possibility for catastrophic failures) associ- ofthe spill.
ated with compressed gases. In both release cases, liquid or vapor, leak detection can play
a role in potential risks. This is discussed briefly under
Release models Dispersion in a subsequent section and also in Chapter 1 1.
An underlying premise in risk assessment is that larger spill Hazardous vapor releases
quantities lead to greater consequences. In addition to spill
size, the evaluator must identify what kinds of hazards might be In an initial risk assessment for most general purposes, it is
involved since some are more sensitive to release rate, while suggested that a leak scenario of a complete line failure-a
others are more sensitive to total volume released. The rate guillotine-type shear failure-should be used to model the
of release is the dominant mechanism for most short-term worst case leak rate. This type of failure causes the leak rate to
thermal damage potential scenarios, whereas the volume of be calculated based on the line diameter and pressure. Even
release is the dominant mechanism for many contamination- though this type of line failure is rare, the risk assessment is still
potential scenarios. Table 7.5 shows some common pipeline valid. By consistency of application, we can choose any hole
products and how the consequences should probably be size and leak rate. We are simply choosing one here that serves
modeled. Each of the modeling types shown in Table 7.5 are the dual role of incorporating the factors of pipe size and line
discussed in this chapter. pressure directly into rating vapor release potential.
Because potential spill sizes are so variable and because Alternatively, several scenarios of failure hole sizes can be
different spill characteristics will be of interest depending on evaluated and then combined. These scenarios could represent
the product type, it is useful to create a spill score to represent the distribution of all possible scenarios and would require that
the relative spill threat. To assess a spill score, the evaluator the relative probability of each hole size be estimated. This
must first determine which state (vapor or liquid) will be requires additional complexity of analysis. However, because this
present after a pipeline failure. If both states exist, the more approach incorporates the fact that the larger hole size scenarios
severe hazard should govern or the spill can be modeled as a are usually rare, it better represents the range of possibilities.
combination of vapor and liquid (see Appendix B). Having determined the failure hole sizes to be used in the
Even though the difficult-to-predict dispersion characteris- assessment, the vapor release scenario also needs estimates for
tics of a vapor release appear more complex than a liquid spill, the characteristics that will determine the potential conse-
the liquid spill is actually more challenging to model. The vapor quences from the release. As discussed previously, the threats
release scenarios lend themselves to some simplifying assump- from a vapor release are generally more dependent on release
tions and the use of a few variables to use as substitutes for the rate than release volume, because the immediate vapor cloud
complex dispersion models. Liquid spills, on the other hand, formation and thermal effects from jet fires are of most con-
are more difficult to generalize because there are infinite possi- cern. Exceptions exist, of course, most notably scenarios that
bilities of variables such as terrain, topography, groundwater, involve accumulation of vapors in confined areas.
Table 7.5 Common pipeline products and modeling of consequences
Product Hazard iype Hazardnature Dominant hazard model
Flammable gas (methane, etc.) Acute Thermal Jet fire; thermal radiation
Toxic gas (chlorine, H,S, etc.) Acute Toxicity Vapor cloud dispersion modeling
Highly volatile liquids (propane, Acute Thermal and blast Vapor cloud dispersion modeling; jet fire;
butane, ethylene, etc.) overpressure (blast) event
Flammable liquid (gasoline, etc.) Acute and chronic Thermal and contamination Pool fire; contamination
Relatively nonflammable liquid Chronic Contamination Contamination
(diesel, fuel oil, etc.)