
Page 171 - Pipeline Risk Management Manual Ideas, Techniques, and Resources
P. 171
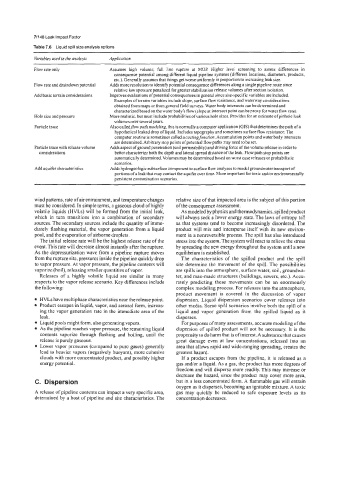
7/148 Leak Impact Factor
           Table 7.6  Liquid spill size analysis options

           Variables used in the analysis   Application
           Flow rate only         Assumes  high  volume;  full  line  rupture  at  MOP.  Higher  level  screening  to  assess  differences  in
                                    consequence potential among different liquid pipeline systems (different locations, diameters, products,
                                    etc.). Generally assumes that things get worse uniformly in proportion to increasing leak size.
           Flow rate and draindown potential   Adds more resolution to identify potential consequence differences along a single pipeline route since
                                    relative low spots are penalized for greater stabilization release volumes after section isolation.
           Add basic terrain considerations   Improves evaluations ofpotential consequences in general since site-specific variables are included.
                                    Examples of terrain variables include slope, surface flow resistance, and waterway considerations
                                    obtained from maps or from general field surveys. Water body intersects can be determined and
                                    characterized based on the water body’s flow (slope at intersect point can be proxy for water flow rate).
           Hole size and pressure   More realistic, but must include probabilities of various hole sizes. Provides for an estimate ofpinhole leak
                                    volumes over several years.
           Particle trace         Also calledflowpath modeling, this is normally a computer application (GIS) that determines the path ofa
                                    hypothetical leaked drop of liquid. Includes topography and sometimes surface flow resistance. The
                                    computer routine is sometimes called a costingfunction. Accumulation points and water body intersects
                                    are determined. Arbitrary stop points of potential flow paths may need to be set.
           Particle trace with release volume   Adds aspect of ground penetration (soil permeability) and driving force ofthe volume release in order to
             considerations         better characterize both the depth and lateral spread distance of the leak. Flow path stop points are
                                    automatically determined. Volumes may be determined based on worst case releases or probabilistic
                                    scenarios.
           Add aquifer characteristics   Adds hydrogeologic subsurface component to surface flow analyses to model groundwater transport of
                                    portions of a leak that may contact the aquifer over time. More important for toxic and/or environmentally
                                    persistent contamination scenarios.

           wind patterns, rate of air entrainment, and temperature changes   relative size of that impacted area is the subject of this portion
           must be considered. In simple terms, a gaseous cloud of highly   ofthe consequence assessment.
           volatile liquids (HVLs) will be formed from the initial leak,   As modeled by physics and thermodynamics, spilledproduct
           which  in  turn  transitions  into  a  combination  of  secondary   will always seek a lower energy state. The laws of entropy tell
           sources. The secondary sources include the quantity of imme-   us that systems tend to become  increasingly disordered. The
           diately flashing material, the vapor generation from a liquid   product will mix and intersperse itself with its new environ-
           pool, and the evaporation of airborne droplets.   ment in a nonreversible process. The spill has also introduced
             The initial release rate will be the highest release rate of the   stress into the system. The system will react to relieve the stress
           event. This rate will decrease almost instantly after the rupture.   by spreading the new energy throughout the system until a new
           As the depressurization wave from a pipeline rupture  moves   equilibrium is established.
           from the rupture site, pressures inside the pipeline quickly drop   The  characteristics of  the  spilled product  and  the  spill
           to vapor pressure. At vapor pressure, the pipeline contents will   site determine the movement  of the  spill. The possibilities
           vaporize (boil), releasing smaller quantities of vapor.   are spills into the atmosphere, surface water, soil, groundwa-
             Releases  of  a  highly  volatile  liquid  are  similar  in  many   ter, and man-made structures (buildings, sewers, etc.). Accu-
           respects to the vapor release scenario. Key differences include   rately  predicting  these  movements  can  be  an  enormously
           the following:                             complex modeling process. For releases into the atmosphere,
                                                      product  movement  is  covered  in  the  discussion  of  vapor
             HVLs have multiphase characteristics near the release point.   dispersion. Liquid  dispersion scenarios cover releases into
             Product escapes in liquid, vapor, and aerosol form, increas-   other media. Some spill scenarios involve both the spill of a
             ing the vapor generation rate in the immediate area of the   liquid  and  vapor  generation  from  the  spilled  liquid  as  it
             leak.                                    disperses.
             Liquid pools might form, also generating vapors.   For purposes of many assessments, accurate modeling ofthe
             As the pipeline reaches vapor pressure, the remaining liquid   dispersion of spilled product will not be necessary. It is the
             contents  vaporize  through  flashing  and  boiling,  until  the   propensity to do harm that is of interest. A substance that causes
             release is purely gaseous.               great  damage  even  at  low  concentrations,  released  into  an
             Lower vapor pressures (compared to pure gases) generally   area that allows rapid and wide-ranging spreading, creates the
             lead to heavier vapors (negatively buoyant), more cohesive   greatest hazard.
             clouds with more concentrated product, and possibly higher   If a product  escapes  from the pipeline,  it is released  as a
             energy potential.                        gas andor a liquid. As a gas, the product has more degrees of
                                                       freedom and will disperse more readily. This may increase or
                                                      decrease the hazard, since the product  may cover more area,
            C.  Dispersion                            but in a less concentrated form. A flammable gas will entrain
                                                       oxygen as it disperses, becoming an ignitable mixture. A toxic
           A release of pipeline contents can impact a very specific area,   gas  may  quickly  be  reduced  to  safe  exposure  levels  as  its
           determined by  a host of pipeline and site characteristics. The   concentration decreases.