
Page 189 - Pipeline Risk Management Manual Ideas, Techniques, and Resources
P. 189
7/166 Leak Impact Factor
A Class 3 area is also defined as a section ofpipeline that has 1,000 people per square mile.” Other Populated Area (OPA)
a high-occupancy building or well-defined outside meeting means “a place, as defined and delineated by the Census
area within the defined area. Buildings such as churches, Bureau that contains a concentrated population, such as an
schools, and shopping centers that are regularly occupied incorporated or unincorporated city, town, village, or other des-
(5 days per week or 10 weeks per year) by 20 or more people are ignated residential or commercial area.”
deemed to be high-occupancy areas. The presence of one of Table 7.17 provides an example of a scale characterizing pop-
these within 660 ft of the pipeline is a sufficient condition to ulation densities on a relative I-to 2-point scale. By this scale,
classify the pipeline section as Class 3. proximity or exposure to a light residential area would raise risk
The population density, as measured by class location, is levels 1.5 times higher than those for a rural area. A heavy com-
admittedly an inexact method of estimating the number of peo- mercial (shopping center, business complex, etc.) or residential
ple likely to be impacted by a pipeline failure. A thorough exposure would double the risk, compared to a rural area.
analysis would necessarily require estimates of people density Another scoring approach that combines a general popula-
(instead of house density), people’s away-from-home patterns, tion classification with special considerations into a 20-point
nearby road traffic, evacuation potential, time of day, day of scale (where more points represents more consequences) is
week, and a host of other factors. This approach is further dis- shown inTable 7.18.
cussed in Chapter 14. The class location, however, is thought to
be reasonably correlated with “potential” population density Population score = [general population] +[special population]
and, as such, will serve the purposes of this risk assessment.
Table 7.15 shows some possible population estimates based on Considerations for restricted mobility populations (nursing
the class locations. homes, rehabilitation centers, etc) and difficult-to-evacuate
For more discrimination within class location categories, a populations might also be appropriate. Additional modeling
continuous scale can be devised in which an actual house count efforts might also assess traffic volumes and occupancies based
would yield a score: 6 houses = 1.6,32 houses = 2.7, etc. More on time-of-day, day-of-week, and/or season.
qualitative estimates such as “high-density class 2 = 2.7” and These methods of incorporating population density into the
“low-density class 2 = 2.1” would also serve to provide added risk analysis support scoring or categorizing approaches. If
discrimination. Additional provisions can be added to make absolute risk values in terms of injury or fatality rates are
distinctions between the four classifications. required, then additional analyses are usually needed. Other
Another population density classification example, expand- methods ofquantifyingpopulations are discussed in Chapter 14.
ing and loosely linked to the DOT classifications, is shown in
Table 7.16. D2. Environmental issues
The U.S. DOT also creates categories of populated areas
for use in determining high consequence areas for certain In most parts of the world today, there is a strong motivation to
pipelines. As defined in a recent regulation (CFR Part 192), ensure that industrial operations are compatible with their envi-
High Population Area (HPA) means “an urbanized area, as
defined and delineated by the Census Bureau, which contains
50,000 or more people and has a population density of at least Table 7.17 Scale that characterizes population densities on a scale
of 1 to 2 points
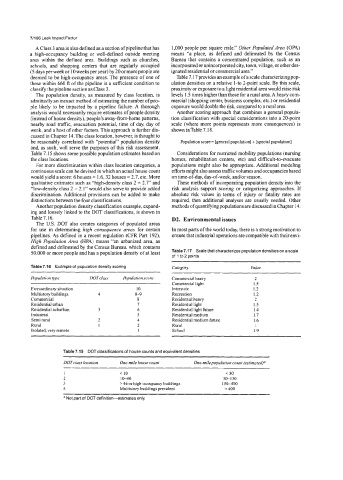
Table 7.16 Example of population density scoring Category Value
Population type DOTclass Population score Commercial heavy 2
Commercial light 1.5
Extraordinary situation 10 Interstate I .2
Multistory buildings 4 8-9 Recreation 1.2
Commercial 8 Residential heavy 2
Residential urban 7 Residential light 1.5
Residential suburban 3 6 Residential light future 1.4
Industrial 5 Residential medium 1.7
Semi rural 2 4 Residential medium future 1.6
Rural 1 2 Rural 1
Isolated, very remote 1 School 1.9
Table 7.15 DOT classifications of house counts and equivalent densities
DOTclass location One-mile house count One-mile population count (estimatedie
1 < 10 < 30
2 IN6 3&150
3 > 46 or high-occupancy buildings 15&400
4 Multistory buildings prevalent > 400
a Not part of DOT definition-estimates only.