
Page 379 - Pipeline Risk Management Manual Ideas, Techniques, and Resources
P. 379
15/354 Risk Management
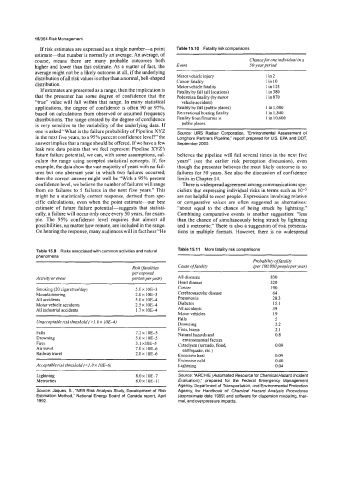
If risk estimates are expressed as a single number-a point Table 15.10 Fatality risk comparisons
estimate-that number is normally an average. An average, of
course, means there are many probable outcomes both Chancefor one individual in a
higher and lower than this estimate. As a matter of fact, the Event 50-year period
average might not be a likely outcome at all, if the underlying
distribution of all risk values is other than a normal, bell-shaped Motor vehicle injury 1 in2
1 in 10
distribution. Cancer fatality I in 123
Motor vehicle fatality
If estimates are presented as a range, then the implication is Fatality by fall (all locations) 1 in 380
that the presenter has some degree of confidence that the Pedestnan fatality (by motor 1 in 870
“true” value will fall within that range. In many statistical vehicle accident)
applications, the degree of confidence is often 90 or 95%, Fatality by fall (public places) 1 in 1,000
based on calculations from observed or assumed frequency Recreational boating fatality 1 in 1,840
distributions. The range created by the degree of confidence Fatality from firearms in I in 10.600
is very sensitive to the variability of the underlying data. If public places
one is asked “What is the failure probability of Pipeline XYZ Source: URS Radian Corporation, “Environmental Assessment of
in the next five years, to a 95% percent confidence level?” the Longhorn Partners Pipeline,” report prepared for US. EPA and DOT,
answer implies that arange should be offered. Ifwe have a few September 2000
leak rate data points that we feel represent Pipeline XYZ’s
future failure potential, we can, with some assumptions, cal- believes the pipeline will fail several times in the next five
culate the range using accepted statistical concepts. If, for years” (see the earlier risk perception discussion), even
example, the data show the vast majority of years with no fail- though the presenter believes the most likely outcome is no
ures but one aberrant year in which two failures occurred, failures for 50 years. See also the discussion of confidence
then the correct answer might well be “With a 95% percent limits in Chapter 14.
confidence level, we believe the number of failures will range There is widespread agreement among communications spe-
from no failures to 5 failures in the next five years.” This cialists that expressing individual risks in terms such as
might be a statistically correct response, derived from spe- are not helpful to most people. Expressions involving relative
cific calculations, even when the point estimate-our best or comparative values are often suggested as alternatives:
estimate of future failure potential-suggests that statisti- “about equal to the chance of being struck by lightning.”
cally, a failure will occur only once every 50 years, for exam- Combining comparative events is another suggestion: “less
ple. The 95% confidence level requires that almost all than the chance of simultaneously being struck by lightning
possibilities, no matter how remote, are included in the range. and a meteorite.” There is also a suggestion of risk presenta-
On hearing the response, many audiences will in fact hear “He tions in multiple formats. However, there is no widespread
Table 15.9 Risks associated with common activities and natural Table 15.1 1 More fatality risk comparisons
phenomena
Probability offatality
Risk Ifatalities Cause offatality @er 100,000peopleper.vear)
per exposed
Activity or event person per year) All diseases 830
Heart disease 320
Smoking (20 cigarettes/day) 5.0~ 10E-3 Cancer 190
Mountaineering 2.0 x 1053 Cerebrovascular disease 64
All accidents 5.0~ 10E4 Pneumonia 28.3
Motor vehicle accidents 2.5 x 10E4 Diabetes 15.1
All industrial accidents 1.7 x 10E4 All accidents 39
Motor vehicles 19
Falls 5
Unacceptable risk threshold p-1.0~ lOE-4)
Drowning 2.2
Fires, bums 2.1
Falls 7.2 x 10E-5 Natural hazards and 0.8
Drowning 5.0~ 10E-5 environmental factors
Fires 3.1 x10E-5 Cataclysm (tornado, flood, 0.09
Air travel 7.0 x 10E-6 earthquake, etc.)
Railway travel 2.0 x 10E-6 Excessive heat 0.09
~ ~~.
~.
Excessive cold 0.40
Acceptable risk threshold (cI.0 x 10E-6) Lightning 0.04
Lightning 8.0 x 1OE-7 Source: “ARCHIE (Automated Resource for Chemical Hazard Incident
Meteorites 6.0 x 10E-11 Evaluation),” prepared for the Federal Emergency Management
Agency, Department of Transportation, and Environmental Protection
Source: Jaques, S., “NEB Risk Analysis Study, Development of Risk Agency, for Handbook of Chemical Hazard Analysis Procedures
Estimation Method,” National Energy Board of Canada report, April (approximate date 1989) and software for dispersion modeling, ther-
1992. mal, and overpressure impacts.