
Page 380 - Pipeline Risk Management Manual Ideas, Techniques, and Resources
P. 380
Risk communications 151355
agreement. Each of the above suggestions is sometimes criti- Canadian NEB study [43] and shows some common risks
cized due to an audience’s unfamiliarity with concepts, ease of expressed in fatalities per year.
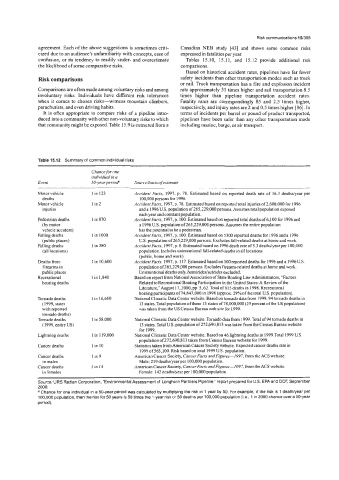
confusion, or its tendency to readily under- and overestimate Tables 15.10, 15.11, and 15.12 provide additional risk
the likelihood of some comparative risks. comparisons.
Based on historical accident rates, pipelines have far fewer
Risk comparisons safety incidents than other transportation modes such as truck
or rail. Truck transportation has a fire and explosion incident
Comparisons are often made among voluntary risks and among rate approximately 35 times higher and rail transportation 8.5
involuntary risks. Individuals have different risk tolerances times higher than pipeline transportation accident rates.
when it comes to chosen risks-witness mountain climbers, Fatality rates are correspondingly 85 and 2.5 times higher,
parachutists, and even driving habits. respectively, and injury rates are 2 and 0.5 times higher [86]. In
It is often appropriate to compare risks of a pipeline intro- terms of incidents per barrel or pound of product transported,
duced into a community with other non-voluntary risks to which pipelines have been safer than any other transportation mode
that community might be exposed. Table 15.9 is extracted from a including marine, barge, or air transport.
Table 15.12 Summary of common individual risks
Chance for one
individual in a
Event 50-yearperiop Source/basis ofestimate
Motor vehicle 1 in 123 Accident Facts, 1997, p. 78. Estimated based on reported death rate of 16.3 deathdyear per
deaths 100,000 persons for 1996.
Motor vehicle 1 m2 Accident Facts, 1997, p. 78. Estimated based on reported total injuries of2,600,000 for 1996
injuries and a 1996 US. population of 265,229,000 persons. Assumes total population exposed
each year and constant population.
Pedestrian deaths 1 in 870 Accident Facts, 1997, p. 100. Estimated based on reported total deaths of6,IOO for 1996 and
(by motor a 1996 U.S. population of 265,229,000 persons. Assumes the entire population
vehicle accident) has the potential to be a pedestrian.
Falling deaths I in 1000 Accident Facts, 1997, p. 100. Estimated based on 5300 reported deaths for 1996 and a 1996
(public places) US. population of 265,229,000 persons. Excludes fall-related deaths at home and work.
Falling deaths 1 in 380 Accidenr Facts, 1997, p. 8. Estimated basedon 1996 death rate of5.3 deathdyearper 100,000
(all locations) population. Includes unintentional fall-related deaths in all locations
(public, home and work).
Deaths from 1 in 10,600 Accident Facts, 1997, p. 11 7. Estimated based on 500 reported deaths for 1996 and a 1996 US
firearms in population of 265,229,000 persons. Excludes firearm-related deaths at home and work.
public places Unintentional deaths only, homicidedsuicides excluded.
Recreational 1 in 1,840 Based on report from National Association of State Boating Law Administrators, “Factors
boating deaths Related to Recreational Boating Participation in the United States: A Review ofthe
Literature:’ August 17,2000, pp, 5,62. Total of 815 deaths in 1998. Recreational
boating participants of 74,847,000 in 1998 (approx. 29% ofthe total US. population).
Tornado deaths I in 16,600 National Climatic Data Center website. Based on tornado data from 1999.94 tornado deaths in
(1999, states 13 states. Total population of these 13 states of 78,000,000 (29 percent of the US population)
with reported was taken from the US Census Bureau web site for 1999.
tornado deaths)
Tornado deaths 1 in 58,000 National Climatic Data Center website. Tornado data from 1999. Total of 94 tornado deaths in
(1999, entire US) 13 states. Total U.S. population of 272,690,s 13 was taken from the Census Bureau website
for 1999.
Lightning deaths 1 in 1 19,000 National Climatic Data Center website. Based on 46 lightning deaths in 1999.Total 1999 US.
population of272,690,813 taken from Census Bureau website for 1999.
Cancer deaths 1 in IO Statistics taken from American Cancer Society website. Expected cancer deaths rate in
1999of563,lOO. Riskbasedontotal 1999U.S. population.
Cancer deaths 1 in9 American Cancer Society, Cancer Facts and Figures-1 997, from the ACS website.
in males Male: 219 deathslyear per 100,000 population.
Cancer deaths 1 in 14 American Cancer Society, Cancer Facts and Figures-1 997, from the ACS website.
in females Female: 142 deathslyear per 100,000 population.
Source: URS Radian Corporation, ’Environmental Assessment of Longhorn Partners Pipeline,” report prepared for US. EPA and DOT, September
2000.
a Chance for one individual in a 50-year period was calculated by multiplying the risk in 1 year by 50. For example, if the risk is 1 death/year per
100,000 population, then the risk for 50 years is 50 times the 1-year risk or 50 deaths per 100,000 population &e.. 1 in 2000 chance over a 50-year
period).