Page 155 - Pipeline Rules of Thumb Handbook
P. 155

142     Pipeline Rules of Thumb Handbook

         F pt1 = 0.999781                                                             Table 1
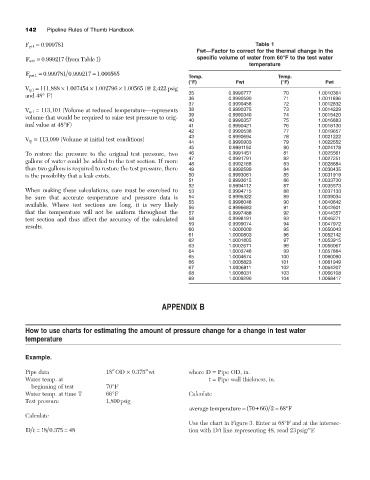
                                                                  Fwt—Factor to correct for the thermal change in the
               0 999217 (
          F wt1 = .    from Table1)                               specific volume of water from 60°F to the test water
                                                                                   temperature
          F pwt1 =  0 999781 0 999217 1 000565
                .
                                  .
                                =
                         .
                                                               Temp.                         Temp.
                                                               (°F)            Fwt            (°F)           Fwt
         V tp1 = 111,888 ¥ 1.007454 ¥ 1.002796 ¥ 1.00565 (@ 2,422 psig
                                                               35            0.9990777         70         1.0010364
         and 48° F)
                                                               36            0.9990590         71         1.0011696
                                                               37            0.9990458         72         1.0012832
         V tp1 = 113,101 (Volume at reduced temperature—represents  38       0.9990375         73         1.0014229
                                                               39            0.9990340         74         1.0015420
         volume that would be required to raise test pressure to orig-
                                                               40            0.9990357         75         1.0016883
         inal value at 48°F)                                   41            0.9990421         76         1.0018130
                                                               42            0.9990536         77         1.0019657
                                                               43            0.9990694         78         1.0021222
         V tp = 113,099 (Volume at initial test conditions)
                                                               44            0.9990903         79         1.0022552
                                                               45            0.9991150         80         1.0024178
         To restore the pressure to the original test pressure, two  46      0.9991451         81         1.0025561
                                                               47            0.9991791         82         1.0027251
         gallons of water could be added to the test section. If more
                                                               48            0.9992168         83         1.0028684
         than two gallons is required to restore the test pressure, there  49  0.9992599       84         1.0030435
         is the possibility that a leak exists.                50            0.9993061         85         1.0031919
                                                               51            0.9993615         86         1.0033730
                                                               52            0.9994112         87         1.0035573
         When making these calculations, care must be exercised to  53       0.9994715         88         1.0037133
         be sure that accurate temperature and pressure data is   54         0.9995322         89         1.0039034
                                                               55            0.9996046         90         1.0040642
         available. Where test sections are long, it is very likely
                                                               56            0.9996683         91         1.0042601
         that the temperature will not be uniform throughout the   57        0.9997488         92         1.0044357
         test section and thus affect the accuracy of the calculated  58     0.9998191         93         1.0046271
                                                               59            0.9999074         94         1.0047972
         results.
                                                               60            1.0000000         95         1.0050043
                                                               61            1.0000803         96         1.0052142
                                                               62            1.0001805         97         1.0053915
                                                               63            1.0002671         98         1.0056067
                                                               64            1.0003746         99         1.0057884
                                                               65            1.0004674        100         1.0060090
                                                               66            1.0005823        101         1.0061949
                                                               67            1.0006811        102         1.0064207
                                                               68            1.0008031        103         1.0066108
                                                               69            1.0009290        104         1.0068417
                                                       APPENDIX B


         How to use charts for estimating the amount of pressure change for a change in test water
         temperature


         Example.

         Pipe data                  18≤OD ¥ 0.375≤wt           where D = Pipe OD, in.
         Water temp. at                                               t = Pipe wall thickness, in.
           beginning of test        70°F
         Water temp. at time T      66°F                       Calculate
         Test pressure              1,800psig
                                                                                         )
                                                                                      +
                                                                                            =
                                                                average temperature = (70 66 2 68 ∞ F
         Calculate
                                                               Use the chart in Figure 3. Enter at 68°F and at the intersec-
          Dt = 18 0 375  = 48                                  tion with D/t line representing 48, read 23psig/°F.
                  .
   150   151   152   153   154   155   156   157   158   159   160