
Page 45 - Pipeline Rules of Thumb Handbook
P. 45
32 Pipeline Rules of Thumb Handbook
Example:
Short diameter = 75 paces = 75 ¥ 3 = 225 feet
Long diameter = 120 paces = 120 ¥ 3 = 360 feet
Average diameter = (225 + 360)/2 = 292 feet
Radius = 292/2 = 146 feet
2
A = r = 3.14186 ¥ 146 ¥ 146 = 66971sq.ft.
Average depth = 3≤ or 0.25ft.
Volume = 66971 ¥ 0.25 = 16743cu.ft.
Figure 2. Average Diameters.
Volume = 2980bbls.
Estimating spill volume on water
When conditions permit, direct measurements of spill more conservative the first estimate of the spill volume, the
parameters are preferred over visual estimates. better the chances that response forces will arrive at the
A rough estimate of spill volume can be generated spill site prepared with adequate and appropriate equipment.
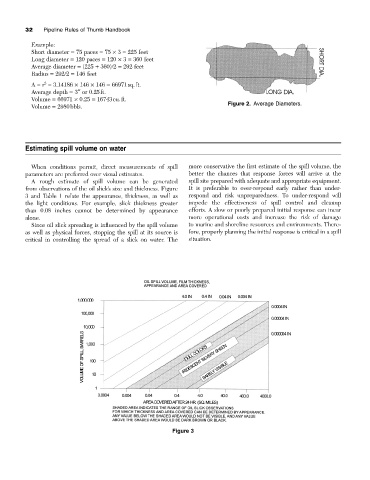
from observations of the oil slick’s size and thickness. Figure It is preferable to over-respond early rather than under-
3 and Table 1 relate the appearance, thickness, as well as respond and risk unpreparedness. To under-respond will
the light conditions. For example, slick thickness greater impede the effectiveness of spill control and cleanup
than 0.08 inches cannot be determined by appearance efforts. A slow or poorly prepared initial response can incur
alone. more operational costs and increase the risk of damage
Since oil slick spreading is influenced by the spill volume to marine and shoreline resources and environments. There-
as well as physical forces, stopping the spill at its source is fore, properly planning the initial response is critical in a spill
critical in controlling the spread of a slick on water. The situation.
Figure 3