
Page 279 - Pipelines and Risers
P. 279
252 Chapter I4
Two alternatives are studied in this example:
1. de-rating;
2. inhibitors.
I
e I
2 I
- -40% Reduction
-
- -30% Reduction
E -.
+.
2 - 20% Reduction
o’
-No
Reduction
6 - - 10% Reduction
Z -1.a I I
0 5 10 15 20
Service Time (Years)
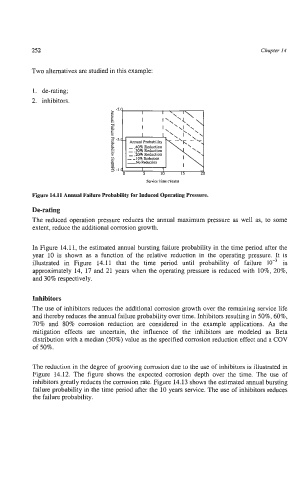
Figure 14.11 Annual Failure Probability for Induced Operating Pressure.
De-rating
The reduced operation pressure reduces the annual maximum pressure as well as, to some
extent, reduce the additional corrosion growth.
In Figure 14.11, the estimated annual bursting failure probability in the time period after the
year 10 is shown as a function of the relative reduction in the operating pressure. It is
illustrated in Figure 14.11 that the time period until probability of failure 10” is
approximately 14, 17 and 21 years when the operating pressure is reduced with IO%, 20%,
and 30% respectively.
Inhibitors
The use of inhibitors reduces the additional corrosion growth over the remaining service life
and thereby reduces the annual failure probability over time. Inhibitors resulting in 50%, 60%,
70% and 80% corrosion reduction are considered in the example applications. As the
mitigation effects are uncertain, the influence of the inhibitors are modeled as Beta
distribution with a median (50%) value as the specified corrosion reduction effect and a COV
of 50%.
The reduction in the degree of grooving corrosion due to the use of inhibitors is illustrated in
Figure 14.12. The figure shows the expected corrosion depth over the time. The use of
inhibitors greatly reduces the corrosion rate. Figure 14.13 shows the estimated annual bursting
failure probability in the time period after the 10 years service. The use of inhibitors reduces
the failure probability.