
Page 321 - Pipelines and Risers
P. 321
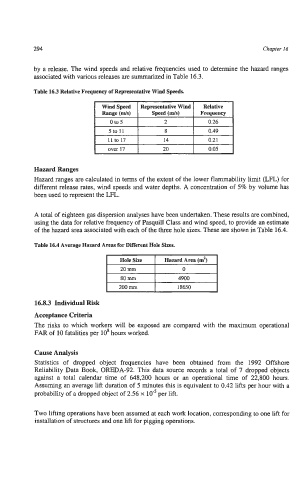
294                                                             Chapter I6


           by a release. The wind speeds and relative frequencies used to determine the hazard ranges
           associated with various releases are summarized in Table 16.3.

           Table 16.3 Relative Frequency of Representative Wind Speeds.
                              Wind Speed   Representative Wind   Relative
                              Range (ds)    Speed (ds)    Frequency
                                0 to 5          2           0.26
                                5 to 11   I     8           0.49
                                11 to17   I    14           0.2 1


           Hazard Ranges
           Hazard ranges are calculated in terms of the extent of the lower flammability limit (LFL) for
           different release rates, wind speeds and water depths. A concentration of  5% by volume has
           been used to represent the LFL.

           A total of eighteen gas dispersion analyses have been undertaken. These results are combined,
           using the data for relative frequency of Pasquill Class and wind speed, to provide an estimate
           of the hazard area associated with each of the three hole sizes. These are shown in Table 16.4.

           Table 16.4 Average Hazard Areas for Different Hole Sizes.
                                   Hole Size    Hazard Area (mz)


                                   200 mm          18650

           16.8.3 Individual Risk
           Acceptance Criteria
           The risks to which  workers will be exposed are compared with  the maximum operational
           FAR of 10 fatalities per 10'  hours worked.


           Cause Analysis
           Statistics  of  dropped  object  frequencies  have  been  obtained  from  the  1992  Offshore
           Reliability Data Book, OREDA-92. This data source records a total  of  7 dropped objects
           against a  total  calendar time  of  648,200  hours  or  an operational time  of  22,800  hours.
           Assuming an average lift duration of 5 minutes this is equivalent to 0.42 lifts per hour with a
           probability of  a dropped object of 2.56 x   per lift.

           Two lifting operations have been assumed at each work location, corresponding to one lift for
           installation of structures and one lift for pigging operations.