
Page 324 - Pipelines and Risers
P. 324
Risk Analysis applied to Subsea Pipeline Engineering 297
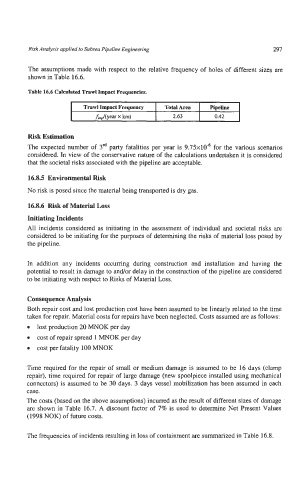
The assumptions made with respect to the relative frequency of holes of different sizes are
shown in Table 16.6.
Table 16.6 Calculated Trawl Impact Frequencies.
Trawl Impact Frequency Total Area Pipeline
x
A ~ C Y ~km) 2.63 0.42
Risk Estimation
The expected number of 3d party fatalities per year is 9.75~10~ the various scenarios
for
considered. In view of the conservative nature of the calculations undertaken it is considered
that the societal risks associated with the pipeline are acceptable.
16.8.5 Environmental Risk
No risk is posed since the material being transported is dry gas.
16.8.6 Risk of Material Loss
Initiating Incidents
All incidents considered as initiating in the assessment of individual and societal risks are
considered to be initiating for the purposes of determining the risks of material loss posed by
the pipeline.
In addition any incidents occurring during construction and installation and having the
potential to result in damage to and/or delay in the construction of the pipeline are considered
to be initiating with respect to Risks of Material Loss.
Consequence Analysis
Both repair cost and lost production cost have been assumed to be linearly related to the time
taken for repair. Material costs for repairs have been neglected. Costs assumed are as follows:
lost production 20 MNOK per day
cost of repair spread 1 MNOK per day
cost per fatality 100 MNOK
Time required for the repair of small or medium damage is assumed to be 16 days (clamp
repair), time required for repair of large damage (new spoolpiece installed using mechanical
connectors) is assumed to be 30 days. 3 days vessel mobilization has been assumed in each
case.
The costs (based on the above assumptions) incurred as the result of different sizes of damage
are shown in Table 16.7. A discount factor of 7% is used to determine Net Present Values
(1998 NOK) of future costs.
The frequencies of incidents resulting in loss of containment are summarized in Table 16.8.