Page 188 - Planning and Design of Airports
P. 188

For ecasting for Airport Planning    155


                                  Annual Enplanements
                  Year      Regional         Airport       Area Population
                  1998      13,060,000        468,900      250,000
                  1999      14,733,000        514,300      260,000
                  2000      16,937,000        637,600      270,000
                  2001      21,896,000        758,200      280,000
                  2002      24,350,000        935,200      290,000
                  2003      28,004,000        995,500      300,000
                  2004      31,658,000        1,139,700    310,000
                  2005      37,226,000        1,360,700    320,000
                  2006      40,753,000        1,488,900    330,000
                  2007      44,018,000        1,650,600    340,000

                 TABLE 5-1  Enplanement Data for Airport Demand Forecast for Use in
                 Example Problems 5-1 through 5-3


                     3600
                     3400        Historical Data           Forecast
                     3200     2900
                     3000
                   Annual Enplanements (Thousands)  2600  2100
                     2800
                     2400
                     2200
                     2000
                     1800
                     1600
                     1400
                     1200
                     1000
                      800
                      600
                      400
                               2000         2005         2010        2015
                                                Year
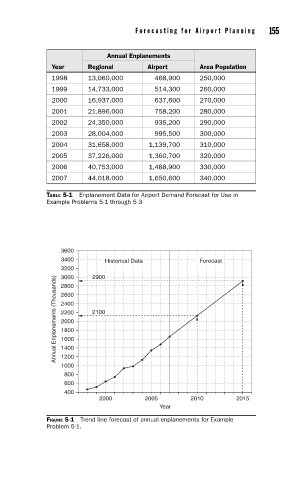
                 FIGURE 5-1  Trend line forecast of annual enplanements for Example
                 Problem 5-1.
   183   184   185   186   187   188   189   190   191   192   193