
Page 191 - Planning and Design of Airports
P. 191
158 Airp o r t Pl anning
3.70 percent in the year 2010 and 3.75 percent in the year 2015 as the proportion of
regional annual enplanements forecast to be captured by the study airport.
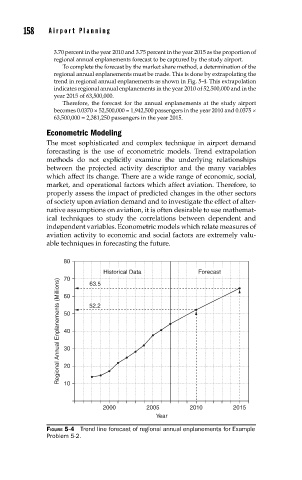
To complete the forecast by the market share method, a determination of the
regional annual enplanements must be made. This is done by extrapolating the
trend in regional annual enplanements as shown in Fig. 5-4. This extrapolation
indicates regional annual enplanements in the year 2010 of 52,500,000 and in the
year 2015 of 63,500,000.
Therefore, the forecast for the annual enplanements at the study airport
becomes 0.0370 × 52,500,000 = 1,942,500 passengers in the year 2010 and 0.0375 ×
63,500,000 = 2,381,250 passengers in the year 2015.
Econometric Modeling
The most sophisticated and complex technique in airport demand
forecasting is the use of econometric models. Trend extrapolation
methods do not explicitly examine the underlying relationships
between the projected activity descriptor and the many variables
which affect its change. There are a wide range of economic, social,
market, and operational factors which affect aviation. Therefore, to
properly assess the impact of predicted changes in the other sectors
of society upon aviation demand and to investigate the effect of alter-
native assumptions on aviation, it is often desirable to use mathemat-
ical techniques to study the correlations between dependent and
independent variables. Econometric models which relate measures of
aviation activity to economic and social factors are extremely valu-
able techniques in forecasting the future.
80
Historical Data Forecast
70
Regional Annual Enplanements (Millions) 50 52.2
63.5
60
40
30
20
10
2000 2005 2010 2015
Year
FIGURE 5-4 Trend line forecast of regional annual enplanements for Example
Problem 5-2.