
Page 193 - Planning and Design of Airports
P. 193
160 Airp o r t Pl anning
eliminated. An illustration of the application of simple linear regres-
sion analysis is presented in Example Problem 5-3.
Example Problem 5-3 The historical data shown in Table 5-1 could also be used to
prepare a forecast of the annual passenger enplanements at the study airport in
the design years 2010 and 2015 using a simple regression analysis.
In applying simple regression analysis to these data, let us assume that a rela-
tionship between the study airport annual enplanements (ENP) and the study
area population (POP) is to be examined. Therefore, it is assumed that a linear
relationship of the form shown in Eq. (5-1) exists between the variables.
ENP = a + a (POP)
0 1
Using a standard regression analysis computer program the relationship is found
to be
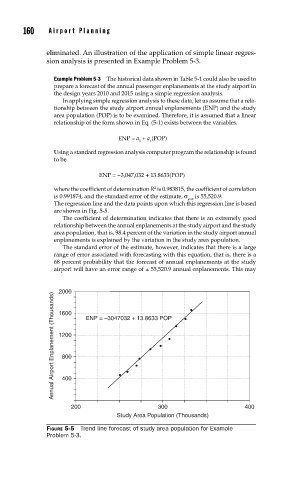
ENP = −3,047,032 + 13.8633(POP)
2
where the coefficient of determination R is 0.983815, the coefficient of correlation
is 0.991874, and the standard error of the estimate, σ is 55,520.9.
yest
The regression line and the data points upon which this regression line is based
are shown in Fig. 5-5.
The coefficient of determination indicates that there is an extremely good
relationship between the annual enplanements at the study airport and the study
area population, that is, 98.4 percent of the variation in the study airport annual
enplanements is explained by the variation in the study area population.
The standard error of the estimate, however, indicates that there is a large
range of error associated with forecasting with this equation, that is, there is a
68 percent probability that the forecast of annual enplanements at the study
airport will have an error range of ± 55,520.9 annual enplanements. This may
2000 ENP = –3047032 + 13.8633 POP
Annual Airport Enplanement (Thousands) 1200
1600
800
400
200 300 400
Study Area Population (Thousands)
FIGURE 5-5 Trend line forecast of study area population for Example
Problem 5-3.