
Page 190 - Planning and Design of Airports
P. 190
4.0 For ecasting for Airport Planning 157
Airport Percentage of Regional Annual Enplanements 3.8
3.6
3.4
1998 2000 2002 2004 2006
Year
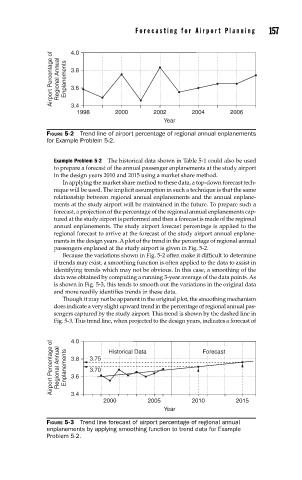
FIGURE 5-2 Trend line of airport percentage of regional annual enplanements
for Example Problem 5-2.
Example Problem 5-2 The historical data shown in Table 5-1 could also be used
to prepare a forecast of the annual passenger enplanements at the study airport
in the design years 2010 and 2015 using a market share method.
In applying the market share method to these data, a top-down forecast tech-
nique will be used. The implicit assumption in such a technique is that the same
relationship between regional annual enplanements and the annual enplane-
ments at the study airport will be maintained in the future. To prepare such a
forecast, a projection of the percentage of the regional annual enplanements cap-
tured at the study airport is performed and then a forecast is made of the regional
annual enplanements. The study airport forecast percentage is applied to the
regional forecast to arrive at the forecast of the study airport annual enplane-
ments in the design years. A plot of the trend in the percentage of regional annual
passengers enplaned at the study airport is given in Fig. 5-2.
Because the variations shown in Fig. 5-2 often make it difficult to determine
if trends may exist, a smoothing function is often applied to the data to assist in
identifying trends which may not be obvious. In this case, a smoothing of the
data was obtained by computing a running 3-year average of the data points. As
is shown in Fig. 5-3, this tends to smooth out the variations in the original data
and more readily identifies trends in these data.
Though it may not be apparent in the original plot, the smoothing mechanism
does indicate a very slight upward trend in the percentage of regional annual pas-
sengers captured by the study airport. This trend is shown by the dashed line in
Fig. 5-3. This trend line, when projected to the design years, indicates a forecast of
4.0
Airport Percentage of Regional Annual Enplanements 3.8 3.75 Historical Data Forecast
3.70
3.6
3.4
2000 2005 2010 2015
Year
FIGURE 5-3 Trend line forecast of airport percentage of regional annual
enplanements by applying smoothing function to trend data for Example
Problem 5-2.