
Page 194 - Planning and Design of Airports
P. 194
For ecasting for Airport Planning 161
or may not be too high depending on the level of annual operations forecast in
the future and the sensitivity of various components of the airport system to
such variations.
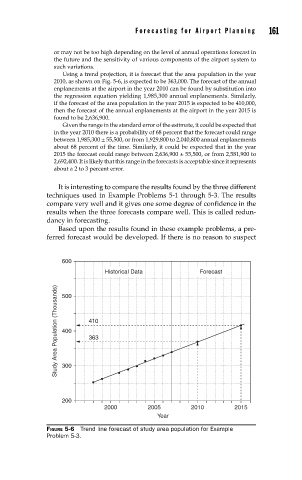
Using a trend projection, it is forecast that the area population in the year
2010, as shown on Fig. 5-6, is expected to be 363,000. The forecast of the annual
enplanements at the airport in the year 2010 can be found by substitution into
the regression equation yielding 1,985,300 annual enplanements. Similarly,
if the forecast of the area population in the year 2015 is expected to be 410,000,
then the forecast of the annual enplanements at the airport in the year 2015 is
found to be 2,636,900.
Given the range in the standard error of the estimate, it could be expected that
in the year 2010 there is a probability of 68 percent that the forecast could range
between 1,985,300 ± 55,500, or from 1,929,800 to 2,040,800 annual enplanements
about 68 percent of the time. Similarly, it could be expected that in the year
2015 the forecast could range between 2,636,900 ± 55,500, or from 2,581,900 to
2,692,400. It is likely that this range in the forecasts is acceptable since it represents
about a 2 to 3 percent error.
It is interesting to compare the results found by the three different
techniques used in Example Problems 5-1 through 5-3. The results
compare very well and it gives one some degree of confidence in the
results when the three forecasts compare well. This is called redun-
dancy in forecasting.
Based upon the results found in these example problems, a pre-
ferred forecast would be developed. If there is no reason to suspect
600
Historical Data Forecast
Study Area Population (Thousands) 400 410
500
363
300
200
2000 2005 2010 2015
Year
FIGURE 5-6 Trend line forecast of study area population for Example
Problem 5-3.