
Page 199 - Planning and Design of Airports
P. 199
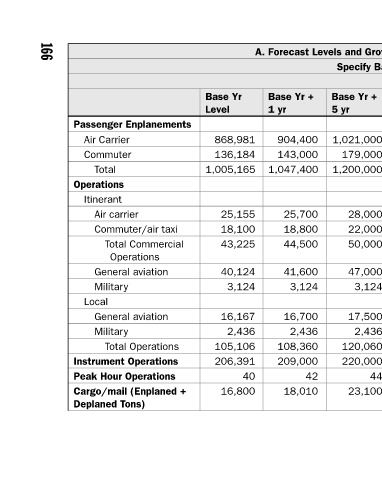
Average Annual Compound Growth Rates
           A. Forecast Levels and Growth Rates (Sample Data Shown)
             Specify Base Year: 2007


                  Base Yr +  Base Yr  Base Yr  Base Yr  Base Yr  Base Yr +  Base Yr +  Base Yr +   to +15  to +10  to +5  to +1  15 yr  10 yr  5 yr  1 yr  4.1%  3.9%  3.3%  4.1% 1,587,000 1,273,000 1,021,000 904,400  5.5%  5.6%  5.6%  5.0% 306,000 234,000 179,000 143,000  4.3%  4.1%  3.6%  4.2% 1,893,000 1,507,000 1,200,000 1,


                  Base Yr   Level  868,981  136,184  1,005,165  25,155  18,100  43,225  40,124  3,124  16,167  2,436  105,106  206,391  40  16,800


                       Passenger Enplanements   Air Carrier   Commuter    Total  Operations   Itinerant    Air carrier    Commuter/air taxi  Total Commercial   Operations    General aviation    Military   Local    General aviation    Military     Total Operations  Instrument Operations  Peak Hour Operations Cargo/mail (Enplane


        166