
Page 201 - Planning and Design of Airports
P. 201
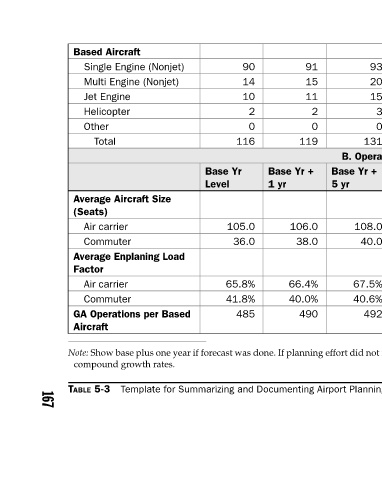
93  0.4%  0.4%  0.7%  1.1%  95  94  5.2%  6.0%  7.4%  7.1%  30  25  20  5.7%  6.6%  8.4%  10.0%  23  19  15  4.7%   4.1%  8.4%  0.0%  4  3  3  0.0%  0.0%  0.0%  0.0%  0  0  0  1.8%  2.0%  2.5%  2.6%  152  141  131  B. Operational Factors  Base Yr +  Base Yr +  Base Yr +   15 yr  10 yr  115.0  111.0  108.0  52.0  4


             91  15  11  2  0  119  5 yr  106.0  38.0  66.4%  40.0%  490
                               Base Yr +   1 yr                      Template for Summarizing and Documenting Airport Planning Forecasts


             90  14  10  2  0  116       105.0  36.0  65.8%  41.8%  485
                               Base Yr   Level


           Based Aircraft  Single Engine (Nonjet)  Multi Engine (Nonjet)   Jet Engine   Helicopter   Other    Total  Average Aircraft Size   (Seats)   Air carrier   Commuter Average Enplaning Load   Factor   Air carrier   Commuter GA Operations per Based   Aircraft  compound growth rates.  TABLE 5-3


                                                                     167