
Page 200 - Planning and Design of Airports
P. 200
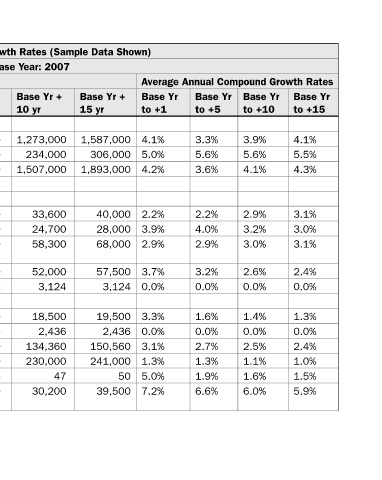
Average Annual Compound Growth Rates  Base Yr  Base Yr  Base Yr   to +15  to +10  to +5  4.1%  3.9%  3.3%  5.5%  5.6%  5.6%  4.3%  4.1%  3.6%  3.1%  2.9%  2.2%  3.0%  3.2%  4.0%  3.1%  3.0%  2.9%  2.4%  2.6%  3.2%  0.0%  0.0%  0.0%  1.3%  1.4%  1.6%  0.0%  0.0%  0.0%  2.4%  2.5%  2.7%  1.0%  1.1%  1.3%  1.5%  1


           A. Forecast Levels and Growth Rates (Sample Data Shown)
                  Base Yr +  Base Yr   to +1  15 yr  4.1% 1,587,000  5.0% 306,000  4.2% 1,893,000  2.2% 40,000  3.9% 28,000  2.9%  68,000  3.7% 57,500  0.0%  3,124  3.3% 19,500  0.0%  2,436  3.1% 150,560  1.3% 241,000  5.0%  50  47  7.2% 39,500


             Specify Base Year: 2007  Base Yr +  Base Yr +   10 yr  1,273,000 1,021,000  234,000 179,000  1,507,000 1,200,000  33,600 28,000  24,700 22,000  58,300  50,000  52,000 47,000  3,124  3,124  18,500 17,500  2,436  2,436  134,360 120,060  230,000 220,000  44  30,200 23,100


                  Base Yr +   5 yr  1 yr  904,400  143,000  1,047,400  25,700  18,800  44,500  41,600  3,124  16,700  2,436  108,360  209,000  42  18,010


                  Base Yr   Level  868,981  136,184  1,005,165  25,155  18,100  43,225  40,124  3,124  16,167  2,436  105,106  206,391  40  16,800


                       Passenger Enplanements   Air Carrier   Commuter    Total  Operations   Itinerant    Air carrier    Commuter/air taxi  Total Commercial   Operations    General aviation    Military   Local    General aviation    Military     Total Operations  Instrument Operations  Peak Hour Operations Cargo/mail (Enplane


        166