
Page 202 - Planning and Design of Airports
P. 202
0.4% 5.2% 5.7% 4.7% 0.0% 1.8%
0.4% 6.0% 6.6% 4.1% 0.0% 2.0%
0.7% 7.4% 8.4% 8.4% 0.0% 2.5%
1.1% 7.1% 10.0% 0.0% 0.0% 2.6%
95 30 23 4 0 152 115.0 52.0 69.0% 42.0% 507
Base Yr + 15 yr
94 25 19 3 0 141 Base Yr + 111.0 46.0 68.2% 41.2% 500
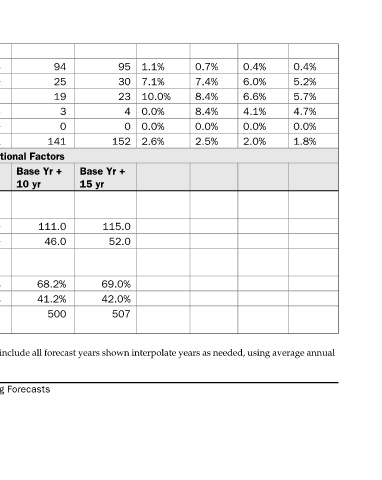
B. Operational Factors 10 yr Note: Show base plus one year if forecast was done. If planning effort did not include all forecast years shown interpolate years as needed, using average annual
93 20 15 3 0 131 Base Yr + 108.0 40.0 67.5% 40.6% 492
91 15 11 2 0 119 5 yr 106.0 38.0 66.4% 40.0% 490
Base Yr + 1 yr Template for Summarizing and Documenting Airport Planning Forecasts
90 14 10 2 0 116 105.0 36.0 65.8% 41.8% 485
Base Yr Level
Based Aircraft Single Engine (Nonjet) Multi Engine (Nonjet) Jet Engine Helicopter Other Total Average Aircraft Size (Seats) Air carrier Commuter Average Enplaning Load Factor Air carrier Commuter GA Operations per Based Aircraft compound growth rates. TABLE 5-3
167