
Page 222 - Planning and Design of Airports
P. 222
Geometric Design of the Airfield 187
N
NNW NNE
35
NW 25 NE 15 mi/h
20
15
WNW ENE
4
W E
ESE
WSW 3.0
SW SE
SSW SSE
S
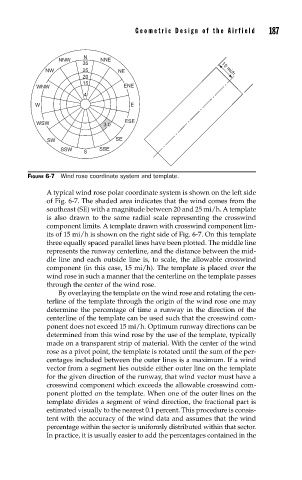
FIGURE 6-7 Wind rose coordinate system and template.
A typical wind rose polar coordinate system is shown on the left side
of Fig. 6-7. The shaded area indicates that the wind comes from the
southeast (SE) with a magnitude between 20 and 25 mi/h. A template
is also drawn to the same radial scale representing the crosswind
component limits. A template drawn with crosswind component lim-
its of 15 mi/h is shown on the right side of Fig. 6-7. On this template
three equally spaced parallel lines have been plotted. The middle line
represents the runway centerline, and the distance between the mid-
dle line and each outside line is, to scale, the allowable crosswind
component (in this case, 15 mi/h). The template is placed over the
wind rose in such a manner that the centerline on the template passes
through the center of the wind rose.
By overlaying the template on the wind rose and rotating the cen-
terline of the template through the origin of the wind rose one may
determine the percentage of time a runway in the direction of the
centerline of the template can be used such that the crosswind com-
ponent does not exceed 15 mi/h. Optimum runway directions can be
determined from this wind rose by the use of the template, typically
made on a transparent strip of material. With the center of the wind
rose as a pivot point, the template is rotated until the sum of the per-
centages included between the outer lines is a maximum. If a wind
vector from a segment lies outside either outer line on the template
for the given direction of the runway, that wind vector must have a
crosswind component which exceeds the allowable crosswind com-
ponent plotted on the template. When one of the outer lines on the
template divides a segment of wind direction, the fractional part is
estimated visually to the nearest 0.1 percent. This procedure is consis-
tent with the accuracy of the wind data and assumes that the wind
percentage within the sector is uniformly distributed within that sector.
In practice, it is usually easier to add the percentages contained in the