
Page 223 - Planning and Design of Airports
P. 223
188 Airp o r t D e sign
sectors outside of the two outer parallel lines and subtract these from
100 percent to find the percentage of wind coverage.
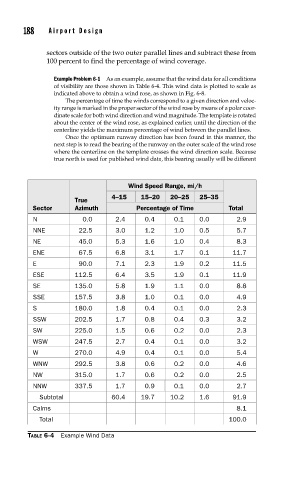
Example Problem 6-1 As an example, assume that the wind data for all conditions
of visibility are those shown in Table 6-4. This wind data is plotted to scale as
indicated above to obtain a wind rose, as shown in Fig. 6-8.
The percentage of time the winds correspond to a given direction and veloc-
ity range is marked in the proper sector of the wind rose by means of a polar coor-
dinate scale for both wind direction and wind magnitude. The template is rotated
about the center of the wind rose, as explained earlier, until the direction of the
centerline yields the maximum percentage of wind between the parallel lines.
Once the optimum runway direction has been found in this manner, the
next step is to read the bearing of the runway on the outer scale of the wind rose
where the centerline on the template crosses the wind direction scale. Because
true north is used for published wind data, this bearing usually will be different
Wind Speed Range, mi/h
4–15 15–20 20–25 25–35
True
Sector Azimuth Percentage of Time Total
N 0.0 2.4 0.4 0.1 0.0 2.9
NNE 22.5 3.0 1.2 1.0 0.5 5.7
NE 45.0 5.3 1.6 1.0 0.4 8.3
ENE 67.5 6.8 3.1 1.7 0.1 11.7
E 90.0 7.1 2.3 1.9 0.2 11.5
ESE 112.5 6.4 3.5 1.9 0.1 11.9
SE 135.0 5.8 1.9 1.1 0.0 8.8
SSE 157.5 3.8 1.0 0.1 0.0 4.9
S 180.0 1.8 0.4 0.1 0.0 2.3
SSW 202.5 1.7 0.8 0.4 0.3 3.2
SW 225.0 1.5 0.6 0.2 0.0 2.3
WSW 247.5 2.7 0.4 0.1 0.0 3.2
W 270.0 4.9 0.4 0.1 0.0 5.4
WNW 292.5 3.8 0.6 0.2 0.0 4.6
NW 315.0 1.7 0.6 0.2 0.0 2.5
NNW 337.5 1.7 0.9 0.1 0.0 2.7
Subtotal 60.4 19.7 10.2 1.6 91.9
Calms 8.1
Total 100.0
TABLE 6-4 Example Wind Data