
Page 228 - Planning and Design of Airports
P. 228
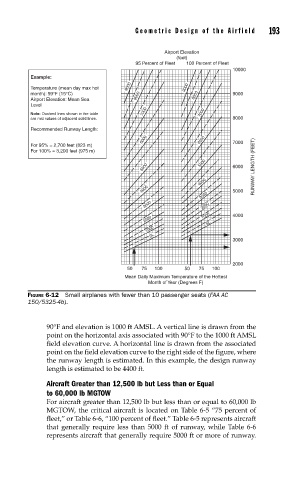
Geometric Design of the Airfield     193


                                                 Airport Elevation
                                                     (feet)
                                         95 Percent of Fleet  100 Percent of Fleet
                                                                    10000
             Example:
                                       9000
             Temperature (mean day max hot             9000
             month): 59°F (15°C)          8000           8000       9000
             Airport Elevation: Mean Sea
             Level
                                           7000
             Note: Dashed lines shown in the table         7000
             are mid values of adjacent solid lines.                8000
             Recommended Runway Length:
                                           6000            6000     7000
             For 95% = 2,700 feet (823 m)
             For 100% = 3,200 feet (975 m)
                                           5000            5000     6000  RUNWAY LENGTH (FEET)

                                                           4000
                                           4000                     5000
                                                           3000
                                            3000            2000
                                            2000            1000 SL  4000
                                            1000
                                             SL
                                                                    3000


                                                                    2000
                                       50  75  100     50  75  100
                                      Mean Daily Maximum Temperature of the Hottest
                                             Month of Year (Degrees F)
            FIGURE 6-12  Small airplanes with fewer than 10 passenger seats (FAA AC
            150/5325-4b).


                 90°F and elevation is 1000 ft AMSL. A vertical line is drawn from the
                 point on the horizontal axis associated with 90°F to the 1000 ft AMSL
                 field elevation curve. A horizontal line is drawn from the associated
                 point on the field elevation curve to the right side of the figure, where
                 the runway length is estimated. In this example, the design runway
                 length is estimated to be 4400 ft.

                 Aircraft Greater than 12,500 lb but Less than or Equal
                 to 60,000 lb MGTOW
                 For aircraft greater than 12,500 lb but less than or equal to 60,000 lb
                 MGTOW, the critical aircraft is located on Table 6-5 “75 percent of
                 fleet,” or Table 6-6, “100 percent of fleet.” Table 6-5 represents aircraft
                 that generally require less than 5000 ft of runway, while Table 6-6
                 represents aircraft that generally require 5000 ft or more of runway.