
Page 229 - Planning and Design of Airports
P. 229
194 Airp o r t D e sign
Representative Airplanes Runway Length Curves
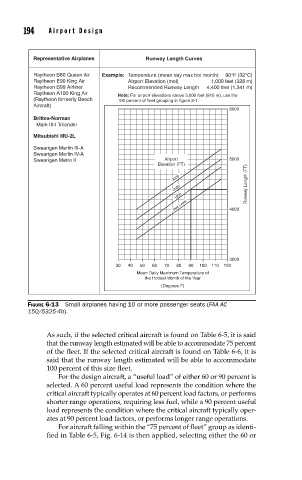
Raytheon B80 Queen Air Example: Temperature (mean day max hot month) 90°F (32°C)
Raytheon E90 King Air Airport Elevation (mol) 1,000 feet (328 m)
Raytheon B99 Airliner Recommended Runway Length 4,400 feet (1,341 m)
Raytheon A100 King Air Note: For airport elevations above 3,000 feet (915 m), use the
(Raytheon formerly Beech 100 percent of fleet grouping in figure 2-1.
Aircraft)
6000
Brittea-Norman
Mark III-I Trilander
Mitsubishi MU-2L
Swearigen Merlin III-A
Swearigen Merlin IV-A
Swearigen Metro II Airport 5000
Elevation (FT)
3000
2000 Runway Length (FT)
1000
Sea Level 4000
3000
30 40 50 60 70 80 90 100 110 120
Mean Daily Maximum Temperature of
the Hottest Month of the Year
(Degrees F)
FIGURE 6-13 Small airplanes having 10 or more passenger seats (FAA AC
150/5325-4b).
As such, if the selected critical aircraft is found on Table 6-5, it is said
that the runway length estimated will be able to accommodate 75 percent
of the fleet. If the selected critical aircraft is found on Table 6-6, it is
said that the runway length estimated will be able to accommodate
100 percent of this size fleet.
For the design aircraft, a “useful load” of either 60 or 90 percent is
selected. A 60 percent useful load represents the condition where the
critical aircraft typically operates at 60 percent load factors, or performs
shorter range operations, requiring less fuel, while a 90 percent useful
load represents the condition where the critical aircraft typically oper-
ates at 90 percent load factors, or performs longer range operations.
For aircraft falling within the “75 percent of fleet” group as identi-
fied in Table 6-5, Fig. 6-14 is then applied, selecting either the 60 or