
Page 73 - Plastics Engineering
P. 73
56 Mechanical Behaviour of Plastics
0
0 0.5 1 1.5 2 2.5 3 3.5
Strain ("74
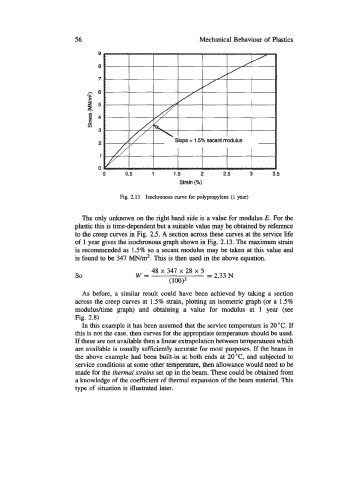
Fig. 2.13 Isochronous curve for polypropylene (1 year)
The only unknown on the right hand side is a value for modulus E. For the
plastic this is time-dependent but a suitable value may be obtained by reference
to the creep curves in Fig. 2.5. A section across these curves at the service life
of 1 year gives the isochronous graph shown in Fig. 2.13. The maximum strain
is recommended as 1.5% so a secant modulus may be taken at this value and
is found to be 347 MN/m2. This is then used in the above equation.
48 x 347 x 28 x 5
so W= = 2.33 N
(W3
As before, a similar result could have been achieved by taking a section
across the creep curves at 1.5% strain, plotting an isometric graph (or a 1.5%
modulus/time graph) and obtaining a value for modulus at 1 year (see
Fig. 2.8)
In this example it has been assumed that the service temperature is 20 "C. If
this is not the case, then curves for the appropriate temperature should be used.
If these are not available then a linear extrapolation between temperatures which
are available is usually sufficiently accurate for most purposes. If the beam in
the above example had been built-in at both ends at 20% and subjected to
service conditions at some other temperature, then allowance would need to be
made for the thermal strains set up in the beam. These could be obtained from
a knowledge of the coefficient of thermal expansion of the beam material. This
type of situation is illustrated later.