
Page 163 - Power Electronic Control in Electrical Systems
P. 163
//SYS21/F:/PEC/REVISES_10-11-01/075065126-CH004.3D ± 151 ± [106±152/47] 17.11.2001 9:54AM
Power electronic control in electrical systems 151
Table 4.11 Nodal complex voltages of HVDC light upgraded network
Voltage System nodes
information
North South Lake Main Elm
jVj (p.u.) 1.036 1.029 1 1.006 0.999
y (degrees) 0 1.402 4.685 3.580 4.722
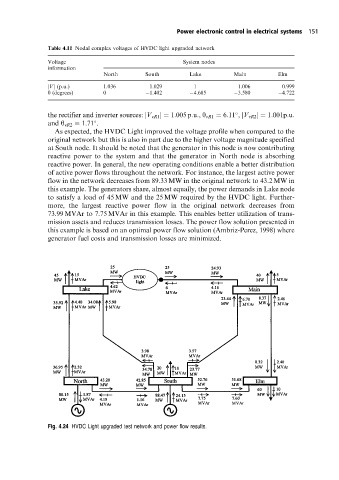
the rectifier and inverter sources: jV vR1 j 1:005 p:u:, y vR1 6:11 , jV vR2 j 1:001p:u:
and y vR2 1:71 .
As expected, the HVDC Light improved the voltage profile when compared to the
original network but this is also in part due to the higher voltage magnitude specified
at South node. It should be noted that the generator in this node is now contributing
reactive power to the system and that the generator in North node is absorbing
reactive power. In general, the new operating conditions enable a better distribution
of active power flows throughout the network. For instance, the largest active power
flow in the network decreases from 89.33 MW in the original network to 43.2 MW in
this example. The generators share, almost equally, the power demands in Lake node
to satisfy a load of 45 MW and the 25 MW required by the HVDC light. Further-
more, the largest reactive power flow in the original network decreases from
73.99 MVAr to 7.75 MVAr in this example. This enables better utilization of trans-
mission assets and reduces transmission losses. The power flow solution presented in
this example is based on an optimal power flow solution (Ambriz-Perez, 1998) where
generator fuel costs and transmission losses are minimized.
Fig. 4.24 HVDC Light upgraded test networkand power flow results.