
Page 354 - Power Electronic Control in Electrical Systems
P. 354
//SYS21/F:/PEC/REVISES_10-11-01/075065126-CH008.3D ± 338 ± [290±372/83] 17.11.2001 10:29AM
338 Transient studies of FACTS and Custom Power equipment
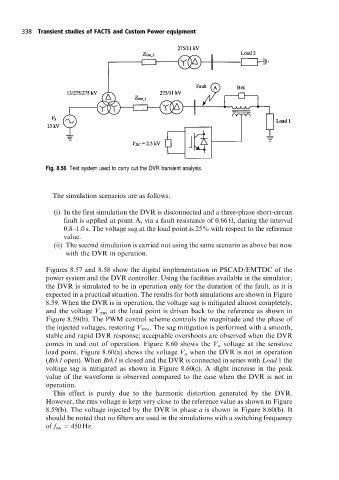
Fig. 8.56 Test system used to carry out the DVR transient analysis.
The simulation scenarios are as follows:
(i) In the first simulation the DVR is disconnected and a three-phase short-circuit
fault is applied at point A, via a fault resistance of 0:66
, during the interval
0.8±1.0 s. The voltage sag at the load point is 25% with respect to the reference
value.
(ii) The second simulation is carried out using the same scenario as above but now
with the DVR in operation.
Figures 8.57 and 8.58 show the digital implementation in PSCAD/EMTDC of the
power system and the DVR controller. Using the facilities available in the simulator,
the DVR is simulated to be in operation only for the duration of the fault, as it is
expected in a practical situation. The results for both simulations are shown in Figure
8.59. When the DVR is in operation, the voltage sag is mitigated almost completely,
and the voltage V rms at the load point is driven back to the reference as shown in
Figure 8.59(b). The PWM control scheme controls the magnitude and the phase of
the injected voltages, restoring V rms . The sag mitigation is performed with a smooth,
stable and rapid DVR response; acceptable overshoots are observed when the DVR
comes in and out of operation. Figure 8.60 shows the V a voltage at the sensitive
load point. Figure 8.60(a) shows the voltage V a when the DVR is not in operation
(Brk1 open). When Brk1 is closed and the DVR is connected in series with Load 1 the
voltage sag is mitigated as shown in Figure 8.60(c). A slight increase in the peak
value of the waveform is observed compared to the case when the DVR is not in
operation.
This effect is purely due to the harmonic distortion generated by the DVR.
However, the rms voltage is kept very close to the reference value as shown in Figure
8.59(b). The voltage injected by the DVR in phase a is shown in Figure 8.60(b). It
should be noted that no filters are used in the simulations with a switching frequency
of f sw 450 Hz.