
Page 388 - Power Electronic Control in Electrical Systems
P. 388
//SYS21/F:/PEC/REVISES_10-11-01/075065126-CH008.3D ± 368 ± [290±372/83] 17.11.2001 10:29AM
368 Transient studies of FACTS and Custom Power equipment
Fig. 8.92 Schematic diagram ofthe test system used to carry out transient analysis of the SSTS.
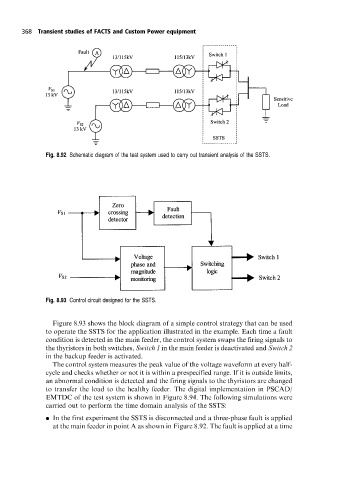
Fig. 8.93 Control circuit designed for the SSTS.
Figure 8.93 shows the block diagram of a simple control strategy that can be used
to operate the SSTS for the application illustrated in the example. Each time a fault
condition is detected in the main feeder, the control system swaps the firing signals to
the thyristors in both switches, Switch 1 in the main feeder is deactivated and Switch 2
in the backup feeder is activated.
The control system measures the peak value of the voltage waveform at every half-
cycle and checks whether or not it is within a prespecified range. If it is outside limits,
an abnormal condition is detected and the firing signals to the thyristors are changed
to transfer the load to the healthy feeder. The digital implementation in PSCAD/
EMTDC of the test system is shown in Figure 8.94. The following simulations were
carried out to perform the time domain analysis of the SSTS:
. In the first experiment the SSTS is disconnected and a three-phase fault is applied
at the main feeder in point A as shown in Figure 8.92. The fault is applied at a time