
Page 123 - Power Quality in Electrical Systems
P. 123
106 Chapter Seven
Spectrum
–20dB/decade
–40dB/decade
f (MHz)
1 2 3 4 5 6 7 8 9 10 11 12 13 14
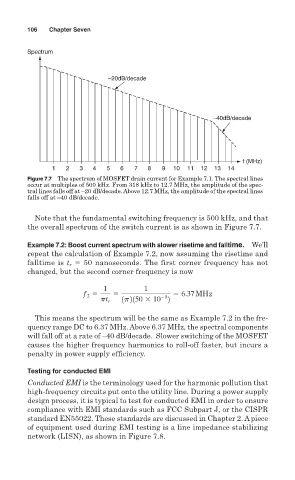
Figure 7.7 The spectrum of MOSFET drain current for Example 7.1. The spectral lines
occur at multiples of 500 kHz. From 318 kHz to 12.7 MHz, the amplitude of the spec-
tral lines falls off at –20 dB/decade. Above 12.7 MHz, the amplitude of the spectral lines
falls off at –40 dB/decade.
Note that the fundamental switching frequency is 500 kHz, and that
the overall spectrum of the switch current is as shown in Figure 7.7.
Example 7.2: Boost current spectrum with slower risetime and falltime. We’ll
repeat the calculation of Example 7.2, now assuming the risetime and
falltime is t 50 nanoseconds. The first corner frequency has not
r
changed, but the second corner frequency is now
1 1
f 6.37MHz
2
9
pt r 1p2150 10 2
This means the spectrum will be the same as Example 7.2 in the fre-
quency range DC to 6.37 MHz. Above 6.37 MHz, the spectral components
will fall off at a rate of –40 dB/decade. Slower switching of the MOSFET
causes the higher frequency harmonics to roll-off faster, but incurs a
penalty in power supply efficiency.
Testing for conducted EMI
Conducted EMI is the terminology used for the harmonic pollution that
high-frequency circuits put onto the utility line. During a power supply
design process, it is typical to test for conducted EMI in order to ensure
compliance with EMI standards such as FCC Subpart J, or the CISPR
standard EN55022. These standards are discussed in Chapter 2. A piece
of equipment used during EMI testing is a line impedance stabilizing
network (LISN), as shown in Figure 7.8.