
Page 128 - Power Quality in Electrical Systems
P. 128
Methods for Correction of Power-Quality Problems 111
Engine-generator (E/G) sets increase the operating time of UPS beyond
the available operating time of the batteries. The E/G sets serve for
long-time utility outages, as well as the prime power supply when main-
tenance is required on the electrical system.
Correction methods for voltage disturbances are classified by whether
or not they require a stored energy source, such as a battery, flywheel,
fuel cell, or other means. As listed earlier, filters require no stored
energy. Voltage compensators may require stored energy to handle deep
and/or long-duration voltage sags. UPSs always require stored energy.
E/G sets require fuel as the energy source.
Voltage disturbances versus
correction methods
Before disturbances in power quality at a site can be corrected, the dis-
turbance must be anticipated or identified. The objective of the correction
must be established, and the correction method selected. The amplitude,
waveform, and duration of voltage disturbances can be determined by
measurement at the site, or by reports of typical disturbances made at the
site or at other similar sites. The impact on the operation of equipment at
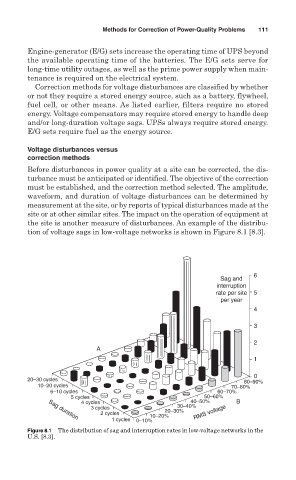
the site is another measure of disturbances. An example of the distribu-
tion of voltage sags in low-voltage networks is shown in Figure 8.1 [8.3].
6
Sag and
interruption
rate per site 5
per year
4
3
2
A
1
0
20–30 cycles
80–90%
10–20 cycles 70–80%
6–10 cycles 60–70%
5 cycles 50–60%
4 cycles 40–50% B
3 cycles 30–40%
20–30%
2 cycles 10–20% RMS voltage
Sag duration
1 cycles 0–10%
Figure 8.1 The distribution of sag and interruption rates in low-voltage networks in the
U.S. [8.3].