
Page 129 - Power Quality in Electrical Systems
P. 129
112 Chapter Eight
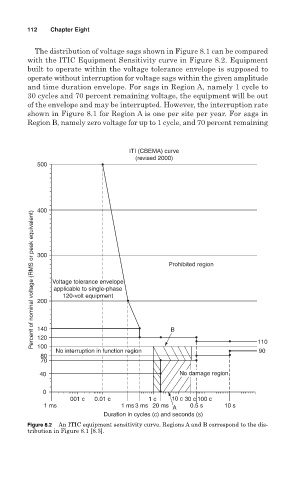
The distribution of voltage sags shown in Figure 8.1 can be compared
with the ITIC Equipment Sensitivity curve in Figure 8.2. Equipment
built to operate within the voltage tolerance envelope is supposed to
operate without interruption for voltage sags within the given amplitude
and time duration envelope. For sags in Region A, namely 1 cycle to
30 cycles and 70 percent remaining voltage, the equipment will be out
of the envelope and may be interrupted. However, the interruption rate
shown in Figure 8.1 for Region A is one per site per year. For sags in
Region B, namely zero voltage for up to 1 cycle, and 70 percent remaining
ITI (CBEMA) curve
(revised 2000)
500
400
Percent of nominal voltage (RMS or peak equivalent)
300
Prohibited region
Voltage tolerance envelope
applicable to single-phase
120-volt equipment
200
140 B
120
110
100
No interruption in function region 90
80
70
40 No damage region
0
001 c 0.01 c 1 c 10 c 30 c 100 c
1 ms 1 ms 3 ms 20 ms A 0.5 s 10 s
Duration in cycles (c) and seconds (s)
Figure 8.2 An ITIC equipment sensitivity curve. Regions A and B correspond to the dis-
tribution in Figure 8.1 [8.3].